Saturday, 31 January 2015

Schedule for Week of February 1, 2015

The key report this week is the January employment report on Friday.

Other key reports include the January ISM manufacturing index on Monday, January vehicle sales on Tuesday, the ISM non-manufacturing index on Wednesday, and the December Trade Deficit on Thursday.

----- Monday, February 2nd -----

8:30 AM ET: Personal Income and Outlays for December. The consensus is for a 0.2% increase in personal income, and for a 0.2% decrease in personal spending. And for the Core PCE price index to be unchanged.

ISM PMI10:00 AM: ISM Manufacturing Index for January. The consensus is for a decrease to 54.5 from 55.5 in December.

Here is a long term graph of the ISM manufacturing index.

The ISM manufacturing index indicated expansion in December at 55.5%. The employment index was at 56.8%, and the new orders index was at 57.3%

10:00 AM: Construction Spending for December. The consensus is for a 0.6% increase in construction spending.

----- Tuesday, February 3rd -----

Vehicle SalesAll day: Light vehicle sales for January. The consensus is for light vehicle sales to decrease to 16.6 million SAAR in January from 16.8 million in December (Seasonally Adjusted Annual Rate).

This graph shows light vehicle sales since the BEA started keeping data in 1967. The dashed line is the December sales rate.

10:00 AM: Manufacturers' Shipments, Inventories and Orders (Factory Orders) for December. The consensus is for a 2.0 decrease in December orders.

----- Wednesday, February 4th -----

7:00 AM: The Mortgage Bankers Association (MBA) will release the results for the mortgage purchase applications index.

8:15 AM: The ADP Employment Report for January. This report is for private payrolls only (no government). The consensus is for 220,000 payroll jobs added in January, down from 241,000 in December.

10:00 AM: ISM non-Manufacturing Index for January. The consensus is for a reading of 56.5, up from 56.2 in December. Note: Above 50 indicates expansion.

----- Thursday, February 5th -----

8:30 AM: The initial weekly unemployment claims report will be released. The consensus is for claims to increase to 290 thousand from 265 thousand.

U.S. Trade Deficit8:30 AM: Trade Balance report for December from the Census Bureau.

This graph shows the U.S. trade deficit, with and without petroleum, through November. The blue line is the total deficit, and the black line is the petroleum deficit, and the red line is the trade deficit ex-petroleum products.

The consensus is for the U.S. trade deficit to be at $38.0 billion in December from $39.0 billion in November.

----- Friday, February 6th -----

8:30 AM: Employment Report for January. The consensus is for an increase of 230,000 non-farm payroll jobs added in January, down from the 252,000 non-farm payroll jobs added in December.

The consensus is for the unemployment rate to be unchanged at 5.6% in January from 5.6% the previous month.
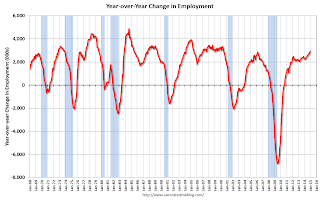
Year-over-year change employmentThis graph shows the year-over-year change in total non-farm employment since 1968.

In December, the year-over-year change was 2.95 million jobs, and that should increase further in January.

As always, a key will be the change in real wages - and as the unemployment rate falls, wage growth should eventually start to pickup.

Notes: The annual benchmark revision will be released with the January report. The preliminary estimate was an additional 7,000 jobs as of March 2014.

Also, the new population controls will be used in the Current Population Survey (CPS) estimation process. It is important to note that "household survey data for January 2015 will not be directly comparable with data for December 2014 or earlier periods". Someone better alert Rick Santelli at CNBC!

3:00 PM: Consumer Credit for December from the Federal Reserve.  The consensus is for credit to increase $15.0 billion.

Unofficial Problem Bank list declines to 388 Institutions

UPDATE: The Federal Reserve announced the termination of the enforcement action for Pacific Mercantile Bancorp, Costa Mesa, California; Pacific Mercantile Bank, Costa Mesa, California on Nov 20, 2014. The bank has been removed from the "unofficial list".

This is an unofficial list of Problem Banks compiled only from public sources.

Here is the unofficial problem bank list for Jan 30, 2015.

Changes and comments from surferdude808:
As expected, the FDIC released an update on its enforcement action activities through December 2014 that contributed to all of the changes to the Unofficial Problem Bank List this week. In all, there were five removals and three additions that leave the list at 388 institutions with assets of $122.5 billion. A year ago, the list held 590 institutions with assets of $195.4 billion. When the weekly was list was first published back on August 7, 2009 it had 389 institutions, so this is the first time a subsequent list held fewer institutions than its inception. There are still 53 institutions from the original list that still remain on it.

FDIC terminated actions against Signature Bank of Arkansas, Fayetteville, AR ($492 million); Village Bank, Saint Francis, MN ($176 million); Golden Eagle Community Bank, Woodstock, IL ($136 million); The Wilmington Savings Bank, Wilmington, OH ($127 million); and VistaBank, Aiken, SC ($107 million).

FDIC issued new actions against Seaway Bank and Trust Company, Chicago, IL ($522 million); International Bank, Raton, NM ($292 million); and Sage Bank, Lowell, MA ($208 million).

Next week will likely see fewer changes to the list.
CR Note: As Surfer Dude noted, the list has come full circle (back to number when we started)!

Friday, 30 January 2015

Restaurant Performance Index shows Expansion in December

I think restaurants are happy with lower gasoline prices (except, I hear, McDonald's) ...

Here is a minor indicator I follow from the National Restaurant Association: Restaurant Performance Index Finished the Year on a Positive Note
Driven by positive sales and traffic and an uptick in capital expenditures, the National Restaurant Association’s Restaurant Performance Index (RPI) finished 2014 with a solid gain. The RPI – a monthly composite index that tracks the health of and outlook for the U.S. restaurant industry – stood at 102.9 in December, up 0.8 percent from its November level of 102.1. In addition, December marked the 22nd consecutive month in which the RPI stood above 100, which signifies expansion in the index of key industry indicators.

“Growth in the RPI was driven by the current situation indicators in December, with a solid majority of restaurant operators reporting higher same-store sales and customer traffic levels,” said Hudson Riehle, senior vice president of the Research and Knowledge Group for the Association. “In addition, six in 10 operators reported making a capital expenditure during the fourth quarter, with a similar proportion planning for capital spending in the first half of 2015.”

“Overall, the RPI posted three consecutive months above 102 for the first time since the first quarter of 2006, which puts the industry on a positive track heading into 2015,” Riehle added.
emphasis added
Restaurant Performance Index Click on graph for larger image.

The index increased to 102.9 in December, down from 102.1 in November. (above 100 indicates expansion).

Restaurant spending is discretionary, so even though this is "D-list" data, I like to check it every month. This is a very solid reading - and it is likely restaurants are benefiting from lower gasoline prices.

Freddie Mac: Mortgage Serious Delinquency rate declined in December

Freddie Mac reported that the Single-Family serious delinquency rate declined in December to 1.88%, down from 1.91% in November. Freddie's rate is down from 2.39% in December 2013, and the rate in December was the lowest level since December 2008. Freddie's serious delinquency rate peaked in February 2010 at 4.20%.

These are mortgage loans that are "three monthly payments or more past due or in foreclosure". 

Note: Fannie Mae will report their Single-Family Serious Delinquency rate for December next week.

Fannie Freddie Seriously Delinquent RateClick on graph for larger image

Although the rate is generally declining, the "normal" serious delinquency rate is under 1%. 

The serious delinquency rate has fallen 0.51 percentage points over the last year - and the rate of improvement has slowed recently - but at that rate of improvement, the serious delinquency rate will not be below 1% until late 2016.

Note: Very few seriously delinquent loans cure with the owner making up back payments - most of the reduction in the serious delinquency rate is from foreclosures, short sales, and modifications. 

So even though distressed sales are declining, I expect an above normal level of Fannie and Freddie distressed sales for 2+ more years (mostly in judicial foreclosure states).

Comment on Q4 GDP and Investment: R-E-L-A-X

There are legitimate concerns about a strong dollar, and weak economic activity overseas, impacting U.S. exports and GDP growth. However, overall, the Q4 GDP report was solid.

The key numbers are: 1) PCE increased at a 4.3% annual rate in Q4 (the two month method nails it again), and 2) private fixed investment increased at a 2.3% rate. The negatives were trade (subtracted 1.02 percentage point) and Federal government spending (subtracted 0.54 percentage points).

As usual, I like to focus on private fixed investment because that is the key to the business cycle.

The first graph shows the Year-over-year (YoY) change in real GDP, real PCE, and real fixed private investment.

Investment Contributions
Click on graph for larger image.

It appears the pace of growth for real GDP and PCE has been picking up a little. Real GDP was up 2.5% Q1 over Q1, and real PCE was up 2.8%. Both will show stronger growth next quarter (since Q1 2014 was so weak).

The dashed black line is the year-over-year change in private fixed investment. This slowed a little in Q4, but has been increasing solidly.

The graph below shows the contribution to GDP from residential investment, equipment and software, and nonresidential structures (3 quarter trailing average). This is important to follow because residential investment tends to lead the economy, equipment and software is generally coincident, and nonresidential structure investment trails the economy.

In the graph, red is residential, green is equipment and software, and blue is investment in non-residential structures. So the usual pattern - both into and out of recessions is - red, green, blue.

The dashed gray line is the contribution from the change in private inventories.

Note: This can't be used blindly.  Residential investment is so low as a percent of the economy that the small decline early last year was not  a concern.

Investment ContributionsClick on graph for larger image.

Residential investment (RI) increased at a 4.1% annual rate in Q4.  Equipment investment decreased at a 1.9% annual rate, and investment in non-residential structures increased at a 2.6% annual rate.   On a 3 quarter trailing average basis, RI is moving up (red), equipment is moving sideways (green), and nonresidential structures dipped a little (blue).

Note: Nonresidential investment in structures typically lags the recovery, however investment in energy and power provided a boost early in this recovery. 

I expect investment to be solid going forward (except for energy and power), and for the economy to grow at a solid pace in 2015.


Final January Consumer Sentiment at 98.1

Consumer Sentiment
Click on graph for larger image.

The final University of Michigan consumer sentiment index for January was at 98.1, down slightly from the preliminary estimate of 98.2, and up from 93.6 in December.

This was close to the consensus forecast of 98.2. Lower gasoline prices and a better labor market are probably the reasons for the recent increase.

BEA: Real GDP increased at 2.6% Annualized Rate in Q4

From the BEA: Gross Domestic Product: Fourth Quarter and Annual 2014 (Advance Estimate)
Real gross domestic product -- the value of the production of goods and services in the United States, adjusted for price changes -- increased at an annual rate of 2.6 percent in the fourth quarter of 2014, according to the "advance" estimate released by the Bureau of Economic Analysis. In the third quarter, real GDP increased 5.0 percent.
...
The increase in real GDP in the fourth quarter reflected positive contributions from personal consumption expenditures (PCE), private inventory investment, exports, nonresidential fixed investment, state and local government spending, and residential fixed investment that were partly offset by a negative contribution from federal government spending. Imports, which are a subtraction in the calculation of GDP, increased.

The deceleration in real GDP growth in the fourth quarter primarily reflected an upturn in imports, a downturn in federal government spending, and decelerations in nonresidential fixed investment and in exports that were partly offset by an upturn in private inventory investment and an acceleration in PCE.

The price index for gross domestic purchases, which measures prices paid by U.S. residents, decreased 0.3 percent in the fourth quarter, in contrast to an increase of 1.4 percent in the third. Excluding food and energy prices, the price index for gross domestic purchases increased 0.7 percent, compared with an increase of 1.6 percent.
The advance Q4 GDP report, with 2.6% annualized growth, was below expectations of a 3.2% increase.

Personal consumption expenditures (PCE) increased at a 4.3% annualized rate - a strong pace!

The key negatives were trade (subtracted 1.02 percentage point) and Federal government spending (subtracted 0.54 percentage points).

Residential InvestmentClick on graph for larger image.
The first graph shows residential investment as a percent of GDP.

Residential Investment as a percent of GDP has been increasing, but it still below the levels of previous recessions - and I expect RI to continue to increase for the next few years.

I'll break down Residential Investment into components after the GDP details are released this coming week. Note: Residential investment (RI) includes new single family structures, multifamily structures, home improvement, broker's commissions, and a few minor categories.

non-Residential InvestmentThe second graph shows non-residential investment in structures, equipment and "intellectual property products".  Investment is trending up as a percent of GDP..

I'll add details for investment in offices, malls and hotels next week.

Overall this was a solid report with strong PCE and private domestic investment.

Thursday, 29 January 2015

Friday: GDP, Chicago PMI, Consumer Sentiment

From the Atlanta Fed:
The GDPNow model forecast for real GDP growth (seasonally adjusted annual rate) in the fourth quarter of 2014 was 3.5 percent on January 27, unchanged from January 21.
From Nomura:
Incoming data suggest that the economy grew at a slower pace in Q4 than the strong 5.0% growth in Q3. As such, we forecast that GDP increased at a still robust annualized rate of 3.4% in Q4. In particular, we expect final sales to grow by 3.4%, exceeding 3% for the fifth time in six quarters. Personal spending should make a significant positive contribution to growth in Q4. We expect inventory investment to make a negligible negative contribution.
The two month method for forecasting PCE (using October and November), suggests real PCE growth of 4.3% in Q4 (of course December could be disappointing). That would be the best quarter for real PCE growth since 2006.

Friday:
• At 8:30 AM ET, Gross Domestic Product, 4th quarter 2014 (advance estimate). The consensus is that real GDP increased 3.2% annualized in Q4.

• At 9:45 AM, Chicago Purchasing Managers Index for January. The consensus is for a reading of 57.7, down from 58.8 in December.

• At 10:00 AM, the University of Michigan's Consumer sentiment index (final for January). The consensus is for a reading of 98.2, unchanged from the preliminary reading of 98.2, and up from the December reading of 93.6.

Zillow: Case-Shiller House Price Index year-over-year change expected to slow further in December

The Case-Shiller house price indexes for November were released Tuesday. Zillow has started forecasting Case-Shiller a month early - now including the National Index - and I like to check the Zillow forecasts since they have been pretty close.

From Zillow: Expect Recent Trend of Sub-5% Annual Growth in Case-Shiller to Continue into 2015
The November S&P/Case-Shiller (SPCS) data released [Tuesday] showed a slight uptick in the pace of national home value appreciation in the housing market, with annual growth in the U.S. National Index rising to 4.7 percent, from 4.6 percent in October.

Despite the modestly faster pace of growth, annual appreciation in home values as measured by SPCS has been less than 5 percent for the past three months. We anticipate this trend to continue as annual growth in home prices slows to more normal levels between 3 percent and 5 percent. Zillow predicts the U.S. National Index to rise 4.5 percent on an annual basis in December.

The 10- and 20-City Indices saw annual growth rates decline in November; the 10-City index rose 4.2 percent and the 20-City Index rose 4.4 percent – down from rates of 4.4 percent and 4.5 percent, respectively, in October.

The non-seasonally adjusted (NSA) 20-City index fell 0.2 percent from October to November, and we expect it to decrease 0.4 percent in December from November. We expect the same monthly decline in the 10-City Composite Index next month, falling 0.4 percent from November to December (NSA).

All forecasts are shown in the table below. These forecasts are based on the November SPCS data release and the December 2014 Zillow Home Value Index (ZHVI), released Jan. 22. Officially, the SPCS Composite Home Price Indices for December will not be released until Tuesday, Feb. 24.
So the year-over-year change in the Case-Shiller index will probably slow in December.

Zillow Case-Shiller Forecast
  Case-Shiller
Composite 10
Case-Shiller
Composite 20
Case-Shiller
National
NSASANSASANSASA
November
Actual YoY
4.2%4.2%4.3%4.3%4.7%4.7%
December
Forecast
YoY
3.8%3.8%4.0%4.0%4.5%4.5%
December
Forecast
MoM
-0.4%0.2%-0.4%0.3%0.0%0.5%

Philly Fed: State Coincident Indexes increased in 46 states in December

From the Philly Fed:
The Federal Reserve Bank of Philadelphia has released the coincident indexes for the 50 states for December 2014. In the past month, the indexes increased in 46 states and remained stable in four, for a one-month diffusion index of 94. Over the past three months, the indexes increased in 50 states, for a three-month diffusion index of 100.
Note: These are coincident indexes constructed from state employment data. An explanation from the Philly Fed:
The coincident indexes combine four state-level indicators to summarize current economic conditions in a single statistic. The four state-level variables in each coincident index are nonfarm payroll employment, average hours worked in manufacturing, the unemployment rate, and wage and salary disbursements deflated by the consumer price index (U.S. city average). The trend for each state’s index is set to the trend of its gross domestic product (GDP), so long-term growth in the state’s index matches long-term growth in its GDP.
Philly Fed Number of States with Increasing ActivityClick on graph for larger image.

This is a graph is of the number of states with one month increasing activity according to the Philly Fed. This graph includes states with minor increases (the Philly Fed lists as unchanged).

In December, 49 states had increasing activity (including minor increases). This measure has been moving up and down, and is in the normal range for a recovery.


Philly Fed State Conincident Map Here is a map of the three month change in the Philly Fed state coincident indicators. This map was all red during the worst of the recession, and is all green again.

It seems likely that several oil producing states will turn red sometime in 2015 - possibly Texas, North Dakota, Alaska or Oklahoma.

HVS: Q4 2014 Homeownership and Vacancy Rates

The Census Bureau released the Residential Vacancies and Homeownership report for Q4 2014.

This report is frequently mentioned by analysts and the media to track the homeownership rate, and the homeowner and rental vacancy rates.  However, there are serious questions about the accuracy of this survey.

This survey might show the trend, but I wouldn't rely on the absolute numbers.  The Census Bureau is investigating the differences between the HVS, ACS and decennial Census, and analysts probably shouldn't use the HVS to estimate the excess vacant supply or household formation, or rely on the homeownership rate, except as a guide to the trend.

Homeownership Rate Click on graph for larger image.

The Red dots are the decennial Census homeownership rates for April 1st 1990, 2000 and 2010. The HVS homeownership rate decreased to 64.0% in Q4, from 64.4% in Q3.

I'd put more weight on the decennial Census numbers - and given changing demographics, the homeownership rate is probably close to a bottom.

Homeowner Vacancy RateThe HVS homeowner vacancy increased to 1.9% in Q4. 

Are these homes becoming rentals?

Once again - this probably shows the general trend, but I wouldn't rely on the absolute numbers.

Rental Vacancy RateThe rental vacancy rate decreased in Q4 to 7.0% from 7.4% in Q3.

I think the Reis quarterly survey (large apartment owners only in selected cities) is a much better measure of the rental vacancy rate - and Reis reported that the rental vacancy rate increased slightly over the last few quarters - and might have bottomed.

The quarterly HVS is the most timely survey on households, but there are many questions about the accuracy of this survey.

NAR: Pending Home Sales Index decreased 3.7% in December, up 6.1% year-over-year

From the NAR: Pending Home Sales Stall in December
The Pending Home Sales Index, a forward-looking indicator based on contract signings, decreased 3.7 percent to 100.7 in December from a slightly downwardly revised 104.6 in November but is 6.1 percent above December 2013 (94.9). Despite last month’s decline (the largest since December 2013 at 5.8 percent), the index experienced its highest year-over-year gain since June 2013 (11.7 percent).
...
The PHSI in the Northeast experienced the largest decline, dropping 7.5 percent to 82.1 in December, but is still 6.3 percent above a year ago. In the Midwest the index decreased 2.8 percent to 97.1in December, but is 1.9 percent above December 2013.

Pending home sales in the South declined 2.6 percent to an index of 116.6 in December, but are 8.6 percent above last December. The index in the West fell 4.6 percent in December to 94.0, but is 6.3 percent above a year ago.
Note: Contract signings usually lead sales by about 45 to 60 days, so this would usually be for closed sales in January and February.

Weekly Initial Unemployment Claims decreased to 265,000

The DOL reported:
In the week ending January 24, the advance figure for seasonally adjusted initial claims was 265,000, a decrease of 43,000 from the previous week's revised level. This is the lowest level for initial claims since April 15, 2000 when it was 259,000. The previous week's level was revised up by 1,000 from 307,000 to 308,000. The 4-week moving average was 298,500, a decrease of 8,250 from the previous week's revised average. The previous week's average was revised up by 250 from 306,500 to 306,750.

There were no special factors impacting this week's initial claims.
The previous week was revised up to 308,000.

The following graph shows the 4-week moving average of weekly claims since January 2000.

Click on graph for larger image.


The dashed line on the graph is the current 4-week average. The four-week average of weekly unemployment claims decreased to 298,500.

This was much lower than the consensus forecast of 300,000, and the low level of the 4-week average suggests few layoffs.

Wednesday, 28 January 2015

Thursday: Unemployment Claims, Pending Home Sales

On mortgage rates from Matthew Graham at Mortgage News Daily: Mortgage Rates Back to Long Term Lows After Fed
Mortgage rates fell again today, and while the move wasn't big, it was enough to bring most lenders back in line with the best rates from two weeks ago. Those have the added distinction of being the best rates since May 2013. At these levels, 3.625% is widely available as a top tier conforming 30yr fixed quote and a few lenders are quoting 3.5%.
CR Note: The Ten Year yield declined to 1.72% from 1.83% yesterday. The low for the Ten Year yield was 1.4% back in July 2012.

Thursday:
• At 8:30 AM ET, the initial weekly unemployment claims report will be released. The consensus is for claims to decrease to 300 thousand from 307 thousand.

• At 10:00 AM, Pending Home Sales Index for December. The consensus is for a 0.5% increase in the index.

• Also at 10:00 AM, the Q4 Housing Vacancies and Homeownership report from the Census Bureau. This report is frequently mentioned by analysts and the media to report on the homeownership rate, and the homeowner and rental vacancy rates. However, this report doesn't track with other measures (like the decennial Census and the ACS).

EIA: Record Oil Inventories, Imports at 7.4 million barrels per day

Every week the EIA releases a petroleum status report. I wanted to post an excerpt this week for two reasons: 1) Oil inventories are at a record level for this time of year (see blue line on graph), and 2) the US is a very large oil importer at 7.4 million barrels per day (contrary to some myths).

From the EIA: Weekly Petroleum Status Report
U.S. crude oil refinery inputs averaged about 15.3 million barrels per day during the week ending January 23, 2015, 347,000 barrels per day more than the previous week’s average. Refineries operated at 88.0% of their operable capacity last week. ...

U.S. crude oil imports averaged over 7.4 million barrels per day last week, up by 204,000 barrels per day from the previous week. Over the last four weeks, crude oil imports averaged over 7.2 million barrels per day, 4.8% below the same four-week period last year. ...
Oil Inventory
U.S. commercial crude oil inventories (excluding those in the Strategic Petroleum Reserve) increased by 8.9 million barrels from the previous week. At 406.7 million barrels, U.S. crude oil inventories are at the highest level for this time of year in at least the last 80 years.
emphasis added

FOMC Statement: "Economic activity has been expanding at a solid pace", "Patient" on Policy

As expected ... solid growth, patient on policy.

FOMC Statement:
Information received since the Federal Open Market Committee met in December suggests that economic activity has been expanding at a solid pace. Labor market conditions have improved further, with strong job gains and a lower unemployment rate. On balance, a range of labor market indicators suggests that underutilization of labor resources continues to diminish. Household spending is rising moderately; recent declines in energy prices have boosted household purchasing power. Business fixed investment is advancing, while the recovery in the housing sector remains slow. Inflation has declined further below the Committee’s longer-run objective, largely reflecting declines in energy prices. Market-based measures of inflation compensation have declined substantially in recent months; survey-based measures of longer-term inflation expectations have remained stable.

Consistent with its statutory mandate, the Committee seeks to foster maximum employment and price stability. The Committee expects that, with appropriate policy accommodation, economic activity will expand at a moderate pace, with labor market indicators continuing to move toward levels the Committee judges consistent with its dual mandate. The Committee continues to see the risks to the outlook for economic activity and the labor market as nearly balanced. Inflation is anticipated to decline further in the near term, but the Committee expects inflation to rise gradually toward 2 percent over the medium term as the labor market improves further and the transitory effects of lower energy prices and other factors dissipate. The Committee continues to monitor inflation developments closely.

To support continued progress toward maximum employment and price stability, the Committee today reaffirmed its view that the current 0 to 1/4 percent target range for the federal funds rate remains appropriate. In determining how long to maintain this target range, the Committee will assess progress--both realized and expected--toward its objectives of maximum employment and 2 percent inflation. This assessment will take into account a wide range of information, including measures of labor market conditions, indicators of inflation pressures and inflation expectations, and readings on financial and international developments. Based on its current assessment, the Committee judges that it can be patient in beginning to normalize the stance of monetary policy. However, if incoming information indicates faster progress toward the Committee’s employment and inflation objectives than the Committee now expects, then increases in the target range for the federal funds rate are likely to occur sooner than currently anticipated. Conversely, if progress proves slower than expected, then increases in the target range are likely to occur later than currently anticipated.

The Committee is maintaining its existing policy of reinvesting principal payments from its holdings of agency debt and agency mortgage-backed securities in agency mortgage-backed securities and of rolling over maturing Treasury securities at auction. This policy, by keeping the Committee’s holdings of longer-term securities at sizable levels, should help maintain accommodative financial conditions.

When the Committee decides to begin to remove policy accommodation, it will take a balanced approach consistent with its longer-run goals of maximum employment and inflation of 2 percent. The Committee currently anticipates that, even after employment and inflation are near mandate-consistent levels, economic conditions may, for some time, warrant keeping the target federal funds rate below levels the Committee views as normal in the longer run.

Voting for the FOMC monetary policy action were: Janet L. Yellen, Chair; William C. Dudley, Vice Chairman; Lael Brainard; Charles L. Evans; Stanley Fischer; Jeffrey M. Lacker; Dennis P. Lockhart; Jerome H. Powell; Daniel K. Tarullo; and John C. Williams.
emphasis added

Duy: "While We Wait For Yet Another FOMC Statement..."

From Tim Duy: While We Wait For Yet Another FOMC Statement...  Excerpt:
The Fed recognizes that hiking rates prematurely to "give them room" in the next recession is of course self-defeating. They are not going to invite a recession simply to prove they have the tools to deal with another recession.

The reasons the Fed wants to normalize policy are, I fear, a bit more mundane:
1. They believe the economy is approaching a more normal environment with solid GDP growth and near-NAIRU unemployment. They do not believe such an environment is consistent with zero rates.

2. They believe that monetary policy operates with long and variable lags. Consequently, they need to act before inflation hits 2% if they do not want to overshoot their target. And they in fact have no intention of overshooting their target.

3. They do not believe in the secular stagnation story. They do not believe that the estimate of the neutral Fed Funds rate should be revised sharply downward. Hence 25bp, or 50bp, or even 100bp still represents loose monetary policy by their definition.
I am currently of the opinion that there is a reasonable chance the Fed is wrong on the third point, and that they have less room to maneuver than they believe. If so, they will find themselves back at the zero bound in the next recession, very quickly I might add. ...

Whether or not they can maintain their mid-year target is of course the topic du jour. But the logic of those who believe the Fed will not have what it needs in June and thus expect the first hike much later is more convincing than those who argue that they will raise rates due to some pressing need to prepare for the next recession.

MBA: "Mortgage Applications decrease in Latest MBA Weekly Survey"

From the MBA: Mortgage Applications Decrease in Latest MBA Weekly Survey
Mortgage applications decreased 3.2 percent from one week earlier, according to data from the Mortgage Bankers Association’s (MBA) Weekly Mortgage Applications Survey for the week ending January 23, 2015. This week’s results include an adjustment to account for the Martin Luther King holiday. ...

The Refinance Index decreased 5 percent from the previous week. The seasonally adjusted Purchase Index decreased 0.1 percent from one week earlier.
...
The FHA share of total applications increased to 9.1 percent this week from 8.0 percent last week. ...

The average contract interest rate for 30-year fixed-rate mortgages with conforming loan balances ($417,000 or less) increased to 3.83 percent from 3.80 percent, with points decreasing to 0.26 from 0.29 (including the origination fee) for 80 percent loan-to-value ratio (LTV) loans.
emphasis added
Mortgage Refinance Index Click on graph for larger image.


The first graph shows the refinance index.

2014 was the lowest year for refinance activity since year 2000.

It looks like 2015 will see more refinance activity than in 2014, especially from FHA loans!

Mortgage Purchase IndexThe second graph shows the MBA mortgage purchase index.  

According to the MBA, the purchase index is up 1% from a year ago.

Tuesday, 27 January 2015

Wednesday: FOMC Statement

I don't expect much to change in the FOMC statement. I expect "patient" to remain:
"Based on its current assessment, the Committee judges that it can be patient in beginning to normalize the stance of monetary policy."
And this sentence will probably be dropped (it seemed like a one time transition sentence):
"The Committee sees this guidance as consistent with its previous statement that it likely will be appropriate to maintain the 0 to 1/4 percent target range for the federal funds rate for a considerable time following the end of its asset purchase program in October, especially if projected inflation continues to run below the Committee's 2 percent longer-run goal, and provided that longer-term inflation expectations remain well anchored."
The major data flow has been consistent with the FOMC's view; the consensus estimate of Q4 GDP is at 3.2%, and the December employment report was solid (252 thousand jobs added, unemployment rate declined to 5.6%). Inflation too low is an ongoing concern, but overall I think the FOMC will be, uh, patient.

Wednesday:
• At 7:00 AM, the Mortgage Bankers Association (MBA) will release the results for the mortgage purchase applications index.

• At 2:00 PM, FOMC Meeting Statement. The FOMC is expected to retain the word "patient" in the FOMC statement

BLS: Forty-two States had Unemployment Rate Decreases in December

From the BLS: Regional and State Employment and Unemployment Summary
Regional and state unemployment rates were generally lower in December. Forty-two states and the District of Columbia had unemployment rate decreases from November, four states had increases, and four states had no change, the U.S. Bureau of Labor Statistics reported today.
...
Mississippi had the highest unemployment rate among the states in December, 7.2 percent. The District of Columbia had a rate of 7.3 percent. North Dakota again had the lowest jobless rate, 2.8 percent.
State Unemployment Click on graph for larger image.

This graph shows the current unemployment rate for each state (red), and the max during the recession (blue). All states are well below the maximum unemployment rate for the recession.

The size of the blue bar indicates the amount of improvement. 

The states are ranked by the highest current unemployment rate. Mississippi, at 7.2%, had the highest state unemployment rate although D.C was higher.

State UnemploymentThe second graph shows the number of states (and D.C.) with unemployment rates at or above certain levels since January 2006. At the worst of the employment recession, there were 10 states with an unemployment rate at or above 11% (red).

Currently no state has an unemployment rate at or above 8% (light blue); Two states and D.C. are still at or above 7% (dark blue).