CoreLogic ... today released new analysis showing 1.2 million borrowers regained equity in 2014, bringing the total number of mortgaged residential properties with equity at the end of Q4 2014 to approximately 44.5 million or 89 percent of all mortgaged properties. Nationwide, borrower equity increased year over year by $656 billion in Q4 2014. The CoreLogic analysis also indicates approximately 172,000 U.S. homes slipped into negative equity in the fourth quarter of 2014 from the third quarter 2014, increasing the total number of mortgaged residential properties with negative equity to 5.4 million, or 10.8 percent of all mortgaged properties. This compares to 5.2 million homes, or 10.4 percent, that were reported with negative equity in Q3 2014, a quarter-over-quarter increase of 3.3 percent. Compared to 6.6 million homes, or 13.4 percent, reported for Q4 2013, the number of underwater homes has decreased year over year by 1.2 million or 18.9 percent.
... Of the 49.9 million residential properties with a mortgage, approximately 10 million, or 20 percent, have less than 20-percent equity (referred to as “under-equitied”) and 1.4 million of those have less than 5-percent equity (referred to as near-negative equity). Borrowers who are “under-equitied” “under-equitied” may have a more difficult time refinancing their existing homes or obtaining new financing to sell and buy another home due to underwriting constraints. Borrowers with near negative equity are considered at risk of moving into negative equity if home prices fall. In contrast, if home prices rose by as little as 5 percent, an additional 1 million homeowners now in negative equity would regain equity. ...
“The share of homeowners that had negative equity increased slightly in the fourth quarter of 2014, reflecting the typical weakness in home values during the final quarter of the year,” said Dr. Frank Nothaft, chief economist for CoreLogic. “Our CoreLogic HPI dipped 0.7 percent from September to December, and the percent of owners 'underwater' increased to 10.8 percent. However, from December-to-December, the CoreLogic index was up 4.8 percent, and the negative equity share fell by 2.6 percentage points.”
emphasis added
 Click on graph for larger image.
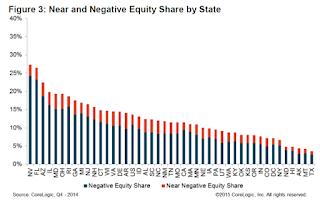
This graph shows the break down of negative equity by state. Note: Data not available for some states. From CoreLogic:
"Nevada had the highest percentage of mortgaged properties in negative equity at 24.2 percent; followed by Florida (23.2 percent); Arizona (18.7 percent); Illinois (16.2 percent) and Rhode Island (15.8 percent). These top five states combined account for 31.7 percent of negative equity in the United States."
Note: The share of negative equity is still very high in Nevada and Florida, but down from a year ago (Q4 2013) when the negative equity share in Nevada was at 30.4 percent, and at 28.1 percent in Florida.
 The second graph shows the distribution of home equity in Q4 compared to Q3 2014. Close to 4% of residential properties have 25% or more negative equity.
In Q4 2013, there were 6.6 million properties with negative equity - now there are 5.4 million. A significant change.
No comments:
Post a Comment