Saturday 28 February 2015

Schedule for Week of March 1, 2015

The key report this week is the February employment report on Friday.

Other key indicators include the January Personal Income and Outlays report on Monday, February ISM manufacturing index also on Monday, February vehicle sales on Tuesday, the ISM non-manufacturing index on Wednesday, and the January Trade Deficit on Friday.

----- Monday, March 2nd -----

8:30 AM ET: Personal Income and Outlays for January. The consensus is for a 0.4% increase in personal income, and for a 0.1% decrease in personal spending. And for the Core PCE price index to increase 0.1%.

ISM PMI10:00 AM: ISM Manufacturing Index for February. The consensus is for a decrease to 53.0 from 53.5 in January.

Here is a long term graph of the ISM manufacturing index.

The ISM manufacturing index indicated expansion in January at 53.5%. The employment index was at 54.1%, and the new orders index was at 52.9%

10:00 AM: Construction Spending for January. The consensus is for a 0.3% increase in construction spending.

----- Tuesday, March 3rd -----

Vehicle SalesAll day: Light vehicle sales for February. The consensus is for light vehicle sales to increase to 16.7 million SAAR in February from 16.6 million in January (Seasonally Adjusted Annual Rate).

This graph shows light vehicle sales since the BEA started keeping data in 1967. The dashed line is the January sales rate.

8:15 PM: Speech, Fed Chair Janet L. Yellen, Bank Regulation and Supervision, At the Citizens Budget Commission's Annual Awards Dinner, New York, New York

----- Wednesday, March 4th -----

7:00 AM: The Mortgage Bankers Association (MBA) will release the results for the mortgage purchase applications index.

8:15 AM: The ADP Employment Report for February. This report is for private payrolls only (no government). The consensus is for 220,000 payroll jobs added in February, up from 213,000 in January.

10:00 AM: ISM non-Manufacturing Index for February. The consensus is for a reading of 56.5, down from 56.7 in January. Note: Above 50 indicates expansion.

2:00 PM: Federal Reserve Beige Book, an informal review by the Federal Reserve Banks of current economic conditions in their Districts.

----- Thursday, March 5th -----

8:30 AM: The initial weekly unemployment claims report will be released. The consensus is for claims to decrease to 300 thousand from 313 thousand.

10:00 AM: Manufacturers' Shipments, Inventories and Orders (Factory Orders) for January. The consensus is for no change in January orders.

4:30 PM: Dodd-Frank Act Stress Test Results

----- Friday, March 6th -----

8:30 AM: Employment Report for February. The consensus is for an increase of 230,000 non-farm payroll jobs added in February, down from the 257,000 non-farm payroll jobs added in January.

The consensus is for the unemployment rate to decline to 5.6% in February from 5.7% in January.

Year-over-year change employmentThis graph shows the year-over-year change in total non-farm employment since 1968.

In January, the year-over-year change was 3.21 million jobs. This was the highest year-over-year gain since the '90s.

As always, a key will be the change in real wages - and as the unemployment rate falls, wage growth should start to pickup.

U.S. Trade Deficit8:30 AM: Trade Balance report for January from the Census Bureau.

This graph shows the U.S. trade deficit, with and without petroleum, through December. The blue line is the total deficit, and the black line is the petroleum deficit, and the red line is the trade deficit ex-petroleum products.

The consensus is for the U.S. trade deficit to be at $41.8 billion in January from $46.6 billion in December.

3:00 PM: Consumer Credit for January from the Federal Reserve.  The consensus is for credit to increase $15.0 billion.
February 2015: Unofficial Problem Bank list declines to 357 Institutions

This is an unofficial list of Problem Banks compiled only from public sources.

Here is the unofficial problem bank list for February, 2015.

Changes and comments from surferdude808:
Very busy week for the Unofficial Problem Bank List as the FDIC closed a bank and provided an update on its enforcement actions through January 2015. There were 21 removals this week pushing the list count down to 357 institutions with assets of $109.2 billion. A year ago, the list held 566 institutions with assets of $182 billion. During January 2015, the unofficial list declined by 31 institutions after 25 action terminations, four mergers, and two failures. In addition, assets fell by $13.3 billion during the month, which is the largest monthly decline since $18.1 billion in January 2014.

As widely expected, the FDIC closed Doral Bank, San Juan, PR ($5.9 billion Ticker: DRL) today. Doral Bank was the third largest bank on the Unofficial Problem Bank List. Since the on-set of the Great Recession, Doral Bank is the 14th largest bank failure and the 2nd largest failure in Puerto Rico behind the $10.8 billion Westernbank Puerto Rico that failed in 2010.

Finding their way off the list through unassisted mergers were Valley Community Bank, Pleasanton, CA ($130 million Ticker: VCBC); The Bank of Perry, Perry, GA ($116 million); The Peoples Bank, Covington, GA ($96 million); and Winfield Community Bank, Winfield, IL ($55 million).

Actions were terminated against Hancock Bank & Trust Company, Hawesville, KY ($275 million); Frontenac Bank, Earth City, MO ($271 million); CornerstoneBank , Atlanta, GA ($248 million); Florida Citizens Bank, Gainesville, FL ($231 million); The Bank of Versailles, Versailles, MO, ($226 million); Balboa Thrift and Loan Association, Chula Vista, CA ($206 million); The First National Bank of Mount Dora, Mount Dora, FL ($205 million); Colombo Bank, Rockville, MD ($201 million); Uniti Bank, Buena Park, CA ($190 million); Wisconsin River Bank, Sauk City, WI ($97 million); One American Bank, Centerville, SD ($81 million); State Bank of Delano, Delano, MN ($79 million); Currie State Bank, Currie, MN ($67 million); Systematic Savings Bank, Springfield, MO ($36 million); Kentucky Federal Savings and Loan Association, Covington, KY ($36 million); and First National Bank in Pawhuska, Pawhuska, OK ($29 million).

The FDIC provided an update on the Official Problem Bank List figures this week. They currently list 291 institutions with assets of $87 billion. Since the FDIC's last release, the number of institutions on the Official Problem Bank List fell by 38 or 11.6 percent. In contrast, the unofficial list fell by 51 institutions or 12.5 percent over the same period.

Given the slowdown in new additions to the list, we will start publishing updates at month-end going forward.

Friday 27 February 2015

Bank Failure #4 in 2015: Doral Bank, San Juan, Puerto Rico

From the FDIC: Banco Popular De Puerto Rico, Hato Rey, Puerto Rico, Assumes all of the Deposits of Doral Bank, San Juan, Puerto Rico
As of December 31, 2014, Doral Bank had approximately $5.9 billion in total assets and $4.1 billion in total deposits. ... The FDIC estimates that the cost to the Deposit Insurance Fund (DIF) will be $748.9 million. ... Doral Bank is the fourth FDIC-insured institution to fail this year, and the first in Puerto Rico. The last time an FDIC-insured institution was closed in Puerto Rico was on April 30, 2010.
This was a decent size bank a fairly large hit to the DIF.

Lawler on Pending Home Sales: NAR “Fixes’ Bad Data for West Region

From housing economist Tom Lawler:

The National Association of Realtors reported that its Pending Home Sales Index, designed to gauge contract-signing activity on MLS-based existing home sales, increased by 1.2% on a seasonally adjusted basis from December to 104.2 in January. A value of 100 is equal to the average level of contract activity in 2001.

There were significant revisions in historical data – not just seasonally adjusted data but unadjusted data – with all of the unadjusted revisions coming in the West region. As I had noted several times over the past year, most recently in the October 1, 2014 LEHC report (“NAR’s Pending Home Sales Index: The “Curious Case” of the Wild, Wild West”), the NAR’s Pending Home Sales Index for the West had previously made no sense either in terms of the pattern of pending sales vs. closed sales in that region, or in terms of pending sales reports from realtors/MLS in the region. I sent that report to the NAR, and one of their analysts told me that they were aware that the pending data in the West did not look correct, and were looking through archived records to figure out why. Apparently the NAR “found” out why, and the PHSI for the West was revised massively in today’s report, as shown in the table below.

NAR Pending Home Sales Index for the West Region,
2014 (Not Seasonally Adjusted, 2001 = 100
  December 2014
Report
January 2015
Report
% Change
Jan 79.478.0-1.7%
Feb 67.983.022.3%
Mar88.6104.217.6%
Apr79.9105.031.5%
May 99.9106.16.2%
June100.7103.22.5%
July109.7104.1-5.1%
Aug 126.2100.9-20.0%
Sept 111.294.4-15.1%
Oct 109.893.3-15.0%
Nov 101.676.8-24.4%
Dec 65.365.30.0%


Fannie Freddie Seriously Delinquent RateClick on graph for larger image

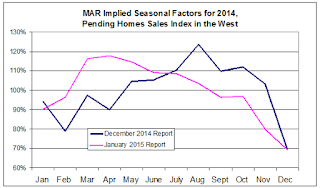
The NAR’s revisions also produced massive changes in the implied seasonal pattern of Pending Home Sales in the West, from the previously “silly” looking pattern to a more reasonable pattern, as shown on this graph.

Prior to the recent revision the NAR’s Pending Home Sales in the West showed a seasonal peak in August, while NAR estimates of closed existing home sales showed a typical seasonal peak in the May/June period. Local realtor reports in the West – including that of the California Association of Realtors – showed pending sales as reaching a seasonal peak around April, a result much more consistent with the seasonal pattern of closed sales.

The revisions in the Pending Home Sales Index for the West go way back, and the West PHSI for 2012, 2013, and 2014 were all revised downward by about 2.3 percentage points.

The revisions in the West PHSI, combined with annual benchmark seasonal adjustment revisions, produced the following changes in the NAR’s National Pending Home Sales Index for 2014.

NAR National Pending Home Sales Index for 2014,
Seasonally Adjusted (2001 = 100)
  December 2014
Report
January 2015
Report
% Change
Jan 94.796.11.5%
Feb 94.295.41.3%
Apr97.998.60.7%
May 103.8101.9-1.8%
June102.5101.9-0.6%
July105.8103.3-2.3%
Aug 104.7103.1-1.6%
Sept 105.3103.7-1.5%
Oct 104.0103.7-0.3%
Nov 104.6104.1-0.5%
Dec 100.7102.51.8%

CR Note: The index was reported at 104.2 in January 2015.

Fed's Fischer: "Conducting Monetary Policy with a Large Balance Sheet"

A review of policy normalization by Fed Vice Chairman Stanley Fischer: Conducting Monetary Policy with a Large Balance Sheet (excerpt)
Turning to policy normalization, the FOMC and market participants anticipate that the federal funds rate will be raised sometime this year. We have for some years been considering ways to operate monetary policy with an elevated balance sheet.

Prior to the financial crisis, because reserve balances outstanding averaged only around $25 billion, relatively minor variations in the total amount of reserves supplied by the Desk could move the equilibrium federal funds rate up or down. With the nearly $3 trillion in excess reserves today, the traditional mechanism of adjustments in the quantity of reserve balances to achieve the desired level of the effective federal funds rate may well not be feasible or sufficiently predictable.

As discussed in the FOMC's statement on its Policy Normalization Principles and Plans, which was published following the September 2014 FOMC meeting, we will use the rate of interest paid on excess reserves (IOER) as our primary tool to move the federal funds rate into the target range.5 This action should encourage banks not to lend to any private counterparty at a rate lower than the rate they can earn on balances maintained at the Fed, which should put upward pressure on a range of short-term interest rates.

Because not all institutions have access to the IOER rate, we will also use an overnight reverse repurchase agreement (ON RRP) facility, as needed. In an ON RRP operation, eligible counterparties may invest funds with the Fed overnight at a given rate. The ON RRP counterparties include 106 money market funds, 22 broker-dealers, 24 depository institutions, and 12 government-sponsored enterprises, including several Federal Home Loan Banks, Fannie Mae, Freddie Mac, and Farmer Mac. This facility should encourage these institutions to be unwilling to lend to private counterparties in money markets at a rate below that offered on overnight reverse repos by the Fed. Indeed, testing to date suggests that ON RRP operations have generally been successful in establishing a soft floor for money market interest rates.6

The Fed could also employ other tools, such as term deposits issued through the Term Deposit Facility and term RRPs, to help drain reserves and put additional upward pressure on short-term interest rates. We have been testing these tools and believe they would help support money market rates, if needed.

Finally, with regard to balance sheet normalization, the FOMC has indicated that it does not anticipate sales of agency mortgage-backed securities, and that it plans to normalize the size of the balance sheet primarily by ceasing reinvestment of principal payments on its existing securities holdings when the time comes. As illustrated in figure 4, cumulative repayments of principal on our existing securities holdings from now through the end of 2025 are projected to be about $3.2 trillion. As a result, when the FOMC chooses to cease reinvestments, the size of the balance sheet will naturally decline, with a corresponding reduction in reserve balances.
emphasis added

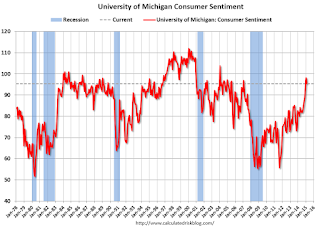
Catching Up: Final February Consumer Sentiment at 95.4, Chicago PMI declines Sharply

Consumer Sentiment
Click on graph for larger image.

The final Reuters / University of Michigan consumer sentiment index for February was at 95.4, up from the preliminary reading of 93.6, and down from 98.1 in January.

This was above the consensus forecast of 94.0. Sentiment has been generally improving, and then surged last year at gasoline prices declined - and the economy improved.  The decline in February was probably related to higher gasoline prices.

Chicago PMI February 2015: Chicago Business Barometer At 5½-Year Low
The Chicago Business Barometer plunged 13.6 points to 45.8 in February, the lowest level since July 2009 and the first time in contraction since April 2013. The sharp fall in business activity in February came as Production, New Orders, Order Backlogs and Employment all suffered double digit losses, leaving them below the 50 level which separates contraction from expansion.

The West Coast port strike and the harsh winter probably had a negative impact in February, although it is difficult to gauge the magnitude.
emphasis added
This was well below the consensus forecast of 58.3.  This is just one month, and the decline could be related to special factors - such as the port strike - and we need to see what happens in March.

NAR: Pending Home Sales Index increased 1.7% in January, up 8.4% year-over-year

From the NAR: Pending Home Sales Rise in January to Highest Level in 18 Months
The Pending Home Sales Index, a forward-looking indicator based on contract signings, climbed 1.7 percent to 104.2 in January from an upwardly revised 102.5 in December and is now 8.4 percent above January 2014 (96.1). This marks the fifth consecutive month of year-over-year gains with each month accelerating the previous month's gain.
...
The PHSI in the Northeast inched 0.1 percent to 84.9 in January, and is now 6.9 percent above a year ago. In the Midwest the index decreased 0.7 percent to 99.3 in January, but is 4.2 percent above January 2014.

Pending home sales experienced the largest increase in the South, up 3.2 percent to an index of 121.9 in January (highest since April 2010) and are 9.7 percent above last January. The index in the West rose 2.2 percent in January to 96.4 and is 11.4 percent above a year ago.

Total existing-homes sales in 2015 are forecast to be around 5.26 million, an increase of 6.4 percent from 2014.
Note: Contract signings usually lead sales by about 45 to 60 days, so this would usually be for closed sales in February and March. I'll take the "under" on the NAR forecast for 2015 sales!

Q4 GDP Revised Down to 2.2% Annual Rate

From the BEA: Gross Domestic Product: Fourth Quarter 2014 (Second Estimate)
Real gross domestic product -- the value of the production of goods and services in the United States, adjusted for price changes -- increased at an annual rate of 2.2 percent in the fourth quarter of 2014, according to the "second" estimate released by the Bureau of Economic Analysis. In the third quarter, real GDP increased 5.0 percent.

The GDP estimate released today is based on more complete source data than were available for the "advance" estimate issued last month. In the advance estimate, the increase in real GDP was 2.6 percent. With the second estimate for the fourth quarter, private inventory investment increased less than previously estimated, while nonresidential fixed investment increased more.

The increase in real GDP in the fourth quarter reflected positive contributions from personal consumption expenditures (PCE), nonresidential fixed investment, exports, state and local government spending, private inventory investment, and residential fixed investment that were partly offset by a negative contribution from federal government spending. Imports, which are a subtraction in the calculation of GDP, increased.

The deceleration in real GDP growth in the fourth quarter primarily reflected an upturn in imports, a downturn in federal government spending, and decelerations in nonresidential fixed investment and in exports that were partly offset by an acceleration in PCE, an upturn in private inventory investment, and an acceleration in state and local government spending.
Here is a Comparison of Second and Advance Estimates.  PCE was revised down from 4.3% to 4.2% - still solid.  Overall about as expected.

Thursday 26 February 2015

Friday: GDP, Chicago PMI, Consumer Sentiment, Pending Home Sales

The following important older post on inflation from Professor Krugman explains why I follow various measures of underlying inflation: Core Logic
[T]he idea of core inflation. Why do we need such a concept, and how should it be measured?

So: core inflation is usually measured by taking food and energy out of the price index; but there are alternative measures, like trimmed-mean and median inflation, which are getting increasing attention.
...
And people who say things like “That’s a stupid concept — people have to spend money on food and gas, so they should be in your inflation measures” are missing the point. Core inflation isn’t supposed to measure the cost of living, it’s supposed to measure something else: inflation inertia.

Think about it this way. Some prices in the economy fluctuate all the time in the face of supply and demand; food and fuel are the obvious examples. Many prices, however, don’t fluctuate this way — they’re set by oligopolistic firms, or negotiated in long-term contracts, so they’re only revised at intervals ranging from months to years. Many wages are set the same way.

The key thing about these less flexible prices — the insight that got Ned Phelps his Nobel — is that because they aren’t revised very often, they’re set with future inflation in mind. Suppose that I’m setting my price for the next year, and that I expect the overall level of prices — including things like the average price of competing goods — to rise 10 percent over the course of the year. Then I’m probably going to set my price about 5 percent higher than I would if I were only taking current conditions into account.

And that’s not the whole story: because temporarily fixed prices are only revised at intervals, their resets often involve catchup. ...

The standard measure tries to do this by excluding the obviously non-inertial prices: food and energy. But are they the whole story? Of course not ... Hence the growing preference among many economists for measures like medians and trimmed means, which exclude prices that move by a lot in any given month, presumably therefore isolating the prices that move sluggishly, which is what we want.
emphasis added
Friday:
• At 8:30 AM ET, Gross Domestic Product, 4th quarter 2014 (second estimate). The consensus is that real GDP increased 2.1% annualized in Q4, down from the advance estimate of 2.6%.

• Also at 9:45 AM, the Chicago Purchasing Managers Index for February. The consensus is for a reading of 58.3, down from 59.4 in January.

• At 10:00 AM: University of Michigan's Consumer sentiment index (final for February). The consensus is for a reading of 94.0, up from the preliminary reading of 93.6, but down from the December reading of 98.1.

• Also at 10:00 AM, the Pending Home Sales Index for January. The consensus is for a 2.0% increase in the index.

• At 1:30 PM: Speech, Fed Vice Chairman Stanley Fischer, Conducting Monetary Policy with a Large Balance Sheet, At the 2015 U.S. Monetary Policy Forum, New York, New York

Freddie Mac: Mortgage Serious Delinquency rate declined slightly in January

Freddie Mac reported that the Single-Family serious delinquency rate declined in January to 1.86%, down from 1.88% in December. Freddie's rate is down from 2.34% in January 2014, and the rate in January was the lowest level since December 2008. Freddie's serious delinquency rate peaked in February 2010 at 4.20%.

These are mortgage loans that are "three monthly payments or more past due or in foreclosure". 

Note: Fannie Mae will report their Single-Family Serious Delinquency rate for January next week.

Fannie Freddie Seriously Delinquent RateClick on graph for larger image

Although the rate is generally declining, the "normal" serious delinquency rate is under 1%. 

The serious delinquency rate has fallen 0.48 percentage points over the last year - and the rate of improvement has slowed recently - but at that rate of improvement, the serious delinquency rate will not be below 1% until late 2016.

Note: Very few seriously delinquent loans cure with the owner making up back payments - most of the reduction in the serious delinquency rate is from foreclosures, short sales, and modifications. 

So even though distressed sales are declining, I expect an above normal level of Fannie and Freddie distressed sales for 2+ more years (mostly in judicial foreclosure states).

Vehicle Sales Forecasts: Best February since 2002

The automakers will report February vehicle sales on Tuesday, March 3rd. Sales in January were at 16.6 million on a seasonally adjusted annual rate basis (SAAR), and it appears sales in February will be about the same, and will probably be the best February since 2002.

Note:  There were 24 selling days in February, the same as last year.  Here are a couple of forecasts:

From J.D. Power: New-Vehicle Retail Sales in February Expected to Cross the Million Mark
New-vehicle retail sales in February 2015 are projected to reach 1,033,100 units, which is a 9 percent increase compared with February 2014 and the highest retail sales volume for the month as well as the first time that February retail sales are expected to exceed 1 million units since February 2002, when sales hit 1.1 million. ...

Total new light-vehicle sales in February 2015 are expected to reach 1.3 million units, a 9 percent increase, compared with February 2014, and match the recent high for the month set in February 2002. [16.7 million SAAR] Fleet volume in February is projected to hit 264,000 units, accounting for 20 percent of total sales.

New-vehicle sales in early 2015 are continuing the robust pattern from the fourth quarter of 2014. As a result, LMC Automotive is increasing its 2015 forecast for both retail and total light vehicles by approximately 40,000 units, each still rounding to 14.0 million and 17.0 million, respectively.

"Strength at the start of 2015 is a key factor in keeping the industry on target to surpass annual vehicle sales of 17 million units for the first time since 2001," said Jeff Schuster, senior vice president of forecasting at LMC Automotive.
And from TrueCar: TrueCar forecasts sustained U.S. auto sales expansion in February with 8.5% volume increase
TrueCar, Inc. ... projects the pace of February auto sales expanded to a seasonally adjusted annualized rate (SAAR) of 16.7 million new units on continued strong consumer demand.

New light vehicle sales, including fleet, should reach 1,295,600 units for the month, up 8.5 percent over a year ago. This same increase is expected on a daily selling rate (DSR) basis with 24 selling days this February versus a year ago.

"Strong February auto sales signal a very healthy U.S. economy," said Eric Lyman, vice president of industry insights for TrueCar. "Given this month's robust demand, the industry remains on track to hit TrueCar's 17 million-unit projection for the 2015."
Another strong month for auto sales.

Key Measures Show Low Inflation in January

The Cleveland Fed released the median CPI and the trimmed-mean CPI this morning:
According to the Federal Reserve Bank of Cleveland, the median Consumer Price Index rose 0.2% (1.9% annualized rate) in January. The 16% trimmed-mean Consumer Price Index rose 0.1% (1.3% annualized rate) during the month. The median CPI and 16% trimmed-mean CPI are measures of core inflation calculated by the Federal Reserve Bank of Cleveland based on data released in the Bureau of Labor Statistics’ (BLS) monthly CPI report.

Earlier today, the BLS reported that the seasonally adjusted CPI for all urban consumers fell 0.7% (−7.8% annualized rate) in January. The CPI less food and energy rose 0.2% (2.2% annualized rate) on a seasonally adjusted basis.
Note: The Cleveland Fed has the median CPI details for January here. Motor fuel declined at a 92% annualized rate in January, following a 69% annualized rate decline in December, a 55% annualized rate decline in November, and a 31% annualized rate decline in October.  However motor fuel will add to inflation in February.

Inflation Measures Click on graph for larger image.

This graph shows the year-over-year change for these four key measures of inflation. On a year-over-year basis, the median CPI rose 2.2%, the trimmed-mean CPI rose 1.8%, and the CPI less food and energy rose 1.6%. Core PCE is for December and increased 1.3% year-over-year.

On a monthly basis, median CPI was at 1.9% annualized, trimmed-mean CPI was at 1.3% annualized, and core CPI was at 2.2% annualized.

On a year-over-year basis these measures suggest inflation remains below the Fed's target of 2% (median CPI is slightly above 2%).

The key question for the Fed is if these key measures will move back towards 2%.

Kansas City Fed: Regional Manufacturing Activity Expanded "Slightly" in February, Weaker Energy Sector

From the Kansas City Fed: Tenth District Manufacturing Activity Rose Just Slightly
The Federal Reserve Bank of Kansas City released the February Manufacturing Survey today. According to Chad Wilkerson, vice president and economist at the Federal Reserve Bank of Kansas City, the survey revealed that Tenth District manufacturing activity rose just slightly from the previous month, but producers expected activity to pick up moderately in the months ahead.

“We saw a further slowing in growth this month, driven in part by weaker factory activity in our energy states”, said Wilkerson. “The raw materials prices index also fell for the first time in over five years.”

The month-over-month composite index was 1 in February, down from 3 in January and 8 in December. The composite index is an average of the production, new orders, employment, supplier delivery time, and raw materials inventory indexes. The overall slower growth was mostly attributable to large declines in primary metals and computer and electronics production. Looking across District states, the weakest activity was in Colorado, Oklahoma, and New Mexico. In contrast, production activity in the fabricated metals and machinery industries both increased moderately. ... the new orders index inched lower from 5 to 3, and the employment index fell for the second straight month.
emphasis added
We are seeing some impact from lower oil prices - however, overall, lower prices is a positive for the economy.

Weekly Initial Unemployment Claims increased to 313,000

The DOL reported:
In the week ending February 21, the advance figure for seasonally adjusted initial claims was 313,000, an increase of 31,000 from the previous week's revised level. The previous week's level was revised down by 1,000 from 283,000 to 282,000. The 4-week moving average was 294,500, an increase of 11,500 from the previous week's revised average. The previous week's average was revised down by 250 from 283,250 to 283,000.

There were no special factors impacting this week's initial claims.
The previous week was revised down to 282,000.

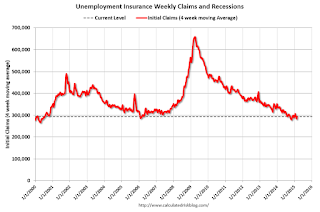
The following graph shows the 4-week moving average of weekly claims since January 2000.

Click on graph for larger image.


The dashed line on the graph is the current 4-week average. The four-week average of weekly unemployment claims increased to 294,500.

This was above the consensus forecast of 290,000, and the low level of the 4-week average suggests few layoffs.

Wednesday 25 February 2015

Thursday: CPI, Unemployment Claims, Durable Goods

First, from the ATA: ATA Truck Tonnage Index Jumped 1.2% in January
American Trucking Associations’ advanced seasonally adjusted For-Hire Truck Tonnage Index increased 1.2% in January, following a revised gain of 0.1% during the previous month. In January, the index equaled 135.7 (2000=100), an all-time high.

Compared with January 2014, the SA index increased 6.6%, which was the largest year-over-year gain in over a year.
...
ATA recently revised the seasonally adjusted index back five years as part of its annual revision. For all of 2014, tonnage was up 3.7%, slightly better than the 3.4% originally reported. In 2013, the index increased 5.5%.

“Truck tonnage continued to improve in January, marking the fourth straight gain totaling 3.5%,” said ATA Chief Economist Bob Costello. “Last year was slightly better for truck tonnage than we originally thought and I am expecting that momentum to continue in 2015.”
emphasis added
Thursday:
• At 8:30 AM ET, the initial weekly unemployment claims report will be released. The consensus is for claims to increase to 290 thousand from 283 thousand.

• Also at 8:30 AM, the Consumer Price Index for January. The consensus is for a 0.6% decrease in CPI, and for core CPI to increase 0.1%.

• Also at 8:30 AM: Durable Goods Orders for January from the Census Bureau. The consensus is for a 1.7% increase in durable goods orders.

• At 9:00 AM, FHFA House Price Index for December 2014. This was originally a GSE only repeat sales, however there is also an expanded index. The consensus is for a 0.5% increase.

• At 11:00 AM: the Kansas City Fed manufacturing survey for February.

MBA: Mortgage Delinquency and Foreclosure Rates Decrease in Q4, Lowest since 2007

Earlier from the MBA: Mortgage Delinquencies Continue to Decrease in Fourth Quarter
The delinquency rate for mortgage loans on one-to-four-unit residential properties decreased to a seasonally adjusted rate of 5.68 percent of all loans outstanding at the end of the fourth quarter of 2014. This was the lowest level since the third quarter of 2007. The delinquency rate decreased 17 basis points from the previous quarter, and 71 basis points from one year ago, according to the Mortgage Bankers Association’s (MBA) National Delinquency Survey.

The delinquency rate includes loans that are at least one payment past due but does not include loans in the process of foreclosure. The percentage of loans in the foreclosure process at the end of the fourth quarter was 2.27 percent, down 12 basis points from the third quarter and 59 basis points lower than the same quarter one year ago. This was the lowest foreclosure inventory rate seen since the fourth quarter of 2007.
...
“Delinquency rates and the percentage of loans in foreclosure decreased for another quarter and were at their lowest levels since 2007,” said Marina Walsh, MBA’s Vice President of Industry Analysis. “We are now back to pre-crisis levels for most measures.”

Walsh continued: “The foreclosure inventory rate has decreased every quarter since the second quarter of 2012, and is now at the lowest level since the fourth quarter of 2007. Foreclosure starts ticked up two basis points, after being flat last quarter, largely due to state-level fluctuations in the speed of the foreclosure process. Compared to the same quarter last year, foreclosure starts are down eight basis points.

“At the state level, 45 states saw a decline in their foreclosure inventory rates over the quarter, although judicial states continue to account for a disproportionately high share. Fewer than half the states had an increase in non-seasonally adjusted 30 day delinquencies, which is highly seasonal and usually increases in the fourth quarter. Foreclosure starts increased in 28 states, but this has become more volatile, with recent state-level mediation requirements and changing laws, as well as servicer procedures, dictating the changes from quarter to quarter.

States that utilize a judicial foreclosure process continue to have a foreclosure inventory rate that is roughly three times that of non-judicial states. For states where the judicial process is more frequently used, 3.79 percent of loans were in the foreclosure process, compared to 1.23 percent in non-judicial states. States that utilize both judicial and non-judicial foreclosure processes had a foreclosure inventory rate closer that of to the non-judicial states at 1.43 percent.

Legacy loans continue to account for the bulk of all troubled mortgages. Within loans that were seriously delinquent (either more than 90 days delinquent or in the foreclosure process), 73 percent of those loans were originated in 2007 and earlier. More recent loan cohorts, specifically loans originated in 2012 and later, continue to exhibit low serious delinquency rates.

“We expect the improvement in mortgage performance to continue due to the improving economy and a strengthening job market, and the improved credit quality of recent vintages.”
emphasis added
MBA Delinquency by PeriodClick on graph for larger image.

This graph shows the percent of loans delinquent by days past due.

The percent of loans 30 and 60 days delinquent are back to normal levels.

The 90 day bucket peaked in Q1 2010, and is about 70% of the way back to normal.

The percent of loans in the foreclosure process also peaked in 2010 and and is about two-thirds of the way back to normal.

So it has taken about 4 years to reduce the backlog of seriously delinquent and in-foreclosure loans by two-thirds, so a rough guess is that serious delinquencies and foreclosure inventory will be back to normal in a couple more years.  Most other measures are already back to normal (still working through the backlog of bubble legacy loans).

Comments on New Home Sales

Earlier: New Home Sales at 481,000 Annual Rate in January, Highest January since 2008

Here is an updated table of new home sales since 2000 and the change from the previous year, including the revisions for the last few months.  Sales in 2014 were only up 1.9% from 2013.

New Home Sales (000s)
YearSales Change
2000877-0.3%
20019083.5%
20029737.2%
20031,08611.6%
20041,20310.8%
20051,2836.7%
20061,051-18.1%
2007776-26.2%
2008485-37.5%
2009375-22.7%
2010323-13.9%
2011306-5.3%
201236820.3%
201342916.6%
20144371.9%

There are two ways to look at 2014: 1) sales were below expectations, or 2) this just means more growth over the next several years!  Both are correct, and what matters now is the present (sales are picking up), and the future (still bright).

It is important not to be influenced too much by one month of data, but if sales averaged the January rate in 2015 of 481 thousand - just moved sideways - then sales for 2015 would be up 10.1% over 2014.

Based on the low level of sales, more lots coming available, changing builder designs and demographics, I expect sales to increase over the next several years.

As I noted last month, it is important to remember that demographics is a slow moving - but unstoppable - force!

It was over four years ago that we started discussing the turnaround for apartments. Then, in January 2011, I attended the NMHC Apartment Strategies Conference in Palm Springs, and the atmosphere was very positive.  One major reason for that optimism was demographics - a large cohort was moving into the renting age group.

Now demographics are slowly becoming more favorable for home buying.

Population 20 to 34 years oldClick on graph for larger image.

This graph shows the longer term trend for several key age groups: 20 to 29, 25 to 34, and 30 to 39 (the groups overlap).

This graph is from 1990 to 2060 (all data from BLS: 1990 to 2013 is actual, 2014 to 2060 is projected).

We can see the surge in the 20 to 29 age group (red).  Once this group exceeded the peak in earlier periods, there was an increase in apartment construction.  This age group will peak in 2018 (until the 2030s), and the 25 to 34 age group (orange, dashed) will peak in 2023.  This suggests demand for apartments will soften starting around 2020 +/-.

For buying, the 30 to 39 age group (blue) is important (note: see Demographics and Behavior for some reasons for changing behavior).  The population in this age group is increasing, and will increase significantly over the next 10+ years.  

This demographics is positive for home buying, and this is a key reason I expect single family housing starts - and new home sales - to continue to increase in coming years.

There are several reasons to expect a return to double digit (or close) new home sales growth in 2015: Builders bringing lower priced homes on the market, more finished lots available, looser credit and demographics (as discussed above).  The housing recovery is ongoing.

And here is another update to the "distressing gap" graph that I first started posting several years ago to show the emerging gap caused by distressed sales. Now I'm looking for the gap to close over the next few years.

Distressing GapThe "distressing gap" graph shows existing home sales (left axis) and new home sales (right axis) through January 2015. This graph starts in 1994, but the relationship has been fairly steady back to the '60s.

Following the housing bubble and bust, the "distressing gap" appeared mostly because of distressed sales.

I expect existing home sales to mostly move sideways (distressed sales will continue to decline and be offset by more conventional / equity sales).  And I expect this gap to slowly close, mostly from an increase in new home sales.

Note: Existing home sales are counted when transactions are closed, and new home sales are counted when contracts are signed. So the timing of sales is different.

Black Knight: Mortgage Delinquencies Declined in January

According to Black Knight's First Look report for January, the percent of loans delinquent decreased 1% in January compared to December, and declined 11% year-over-year.

The percent of loans in the foreclosure process declined slightly in January and were down about 31% over the last year.

Black Knight reported the U.S. mortgage delinquency rate (loans 30 or more days past due, but not in foreclosure) was 5.56% in January, down from 5.64% in December.  The normal rate for delinquencies is around 4.5% to 5%.

The percent of loans in the foreclosure process declined slightly in January and remained at 1.61%.

The number of delinquent properties, but not in foreclosure, is down 327,000 properties year-over-year, and the number of properties in the foreclosure process is down 360,000 properties year-over-year.

Black Knight will release the complete mortgage monitor for February in March.

Black Knight: Percent Loans Delinquent and in Foreclosure Process
  Jan
2015
Dec
2014
Jan
2014
Jan
2013
Delinquent5.56%5.64%6.27%7.03%
In Foreclosure1.61%1.61%2.35%3.41%
Number of properties:
Number of properties that are 30 or more, and less than 90 days past due, but not in foreclosure:1,701,0001,736,0001,851,0001,974,000
Number of properties that are 90 or more days delinquent, but not in foreclosure:1,112,0001,132,0001,289,0001,531,000
Number of properties in foreclosure pre-sale inventory:815,000820,0001,175,0001,703,000
Total Properties3,628,0003,688,0004,315,0005,208,000

New Home Sales at 481,000 Annual Rate in January, Highest January since 2008

The Census Bureau reports New Home Sales in January were at a seasonally adjusted annual rate (SAAR) of 481 thousand.

November sales were revised up from 431 thousand to 446 thousand, and December sales were revised up from 481 thousand to 482 thousand.
"Sales of new single-family houses in January 2015 were at a seasonally adjusted annual rate of 481,000, according to estimates released jointly today by the U.S. Census Bureau and the Department of Housing and Urban Development. This is 0.2 percent below the revised December rate of 482,000, but is 5.3 percent above the January 2014 estimate of 457,000."
New Home SalesClick on graph for larger image.

The first graph shows New Home Sales vs. recessions since 1963. The dashed line is the current sales rate.

Even with the increase in sales over the previous two years, new home sales are barely above the bottom for previous recessions.

The second graph shows New Home Months of Supply.

New Home Sales, Months of SupplyThe months of supply was unchanged in January at 5.4 months.

The all time record was 12.1 months of supply in January 2009.

This is now in the normal range (less than 6 months supply is normal).
"The seasonally adjusted estimate of new houses for sale at the end of January was 218,000. This represents a supply of 5.4 months at the current sales rate."
New Home Sales, InventoryOn inventory, according to the Census Bureau:
"A house is considered for sale when a permit to build has been issued in permit-issuing places or work has begun on the footings or foundation in nonpermit areas and a sales contract has not been signed nor a deposit accepted."
Starting in 1973 the Census Bureau broke this down into three categories: Not Started, Under Construction, and Completed.

The third graph shows the three categories of inventory starting in 1973.

The inventory of completed homes for sale is still low, and the combined total of completed and under construction is also low.

New Home Sales, NSAThe last graph shows sales NSA (monthly sales, not seasonally adjusted annual rate).

In January 2015 (red column), 36 thousand new homes were sold (NSA). Last year 33 thousand homes were sold in January.  This is the highest for January since 2008.

The high for January was 92 thousand in 2005, and the low for January was 21 thousand in 2011.

This was above expectations of 471,000 sales in January, and is a decent start to 2015.  I'll have more later today.

MBA: Purchase Mortgage Applications Increase, Refinance Applications Decrease in Latest MBA Weekly Survey

From the MBA: Mortgage Applications Decrease in Latest MBA Weekly Survey
Mortgage applications decreased 3.5 percent from one week earlier, according to data from the Mortgage Bankers Association’s (MBA) Weekly Mortgage Applications Survey for the week ending February 20, 2015. This week’s results include an adjustment to account for the Presidents’ Day holiday. ...

The Refinance Index decreased 8 percent from the previous week. The seasonally adjusted Purchase Index increased 5 percent from one week earlier.
...
The average contract interest rate for 30-year fixed-rate mortgages with conforming loan balances ($417,000 or less) increased to 3.99 percent from 3.93 percent, with points decreasing to 0.33 from 0.35 (including the origination fee) for 80 percent loan-to-value ratio (LTV) loans.
emphasis added
Mortgage Refinance Index Click on graph for larger image.


The first graph shows the refinance index.

2014 was the lowest year for refinance activity since year 2000.

2015 will probably see more refinance activity than in 2014, but not a large refinance boom.

Mortgage Purchase IndexThe second graph shows the MBA mortgage purchase index.  

According to the MBA, the unadjusted purchase index is down 2% from a year ago.

Tuesday 24 February 2015

Wednesday: New Home Sales, Yellen

The following paragraph from Fed Chair Janet Yellen's testimony today seems to suggest "patient" will be dropped from the FOMC statement at the March 17-18 meeting. Sentence by sentence:
The FOMC's assessment that it can be patient in beginning to normalize policy means that the Committee considers it unlikely that economic conditions will warrant an increase in the target range for the federal funds rate for at least the next couple of FOMC meetings.
That just repeated the current understanding. If the FOMC wants to have the option to raise rates in June, they would most likely drop "patient" from the statement in March (June is the second meeting after March).
If economic conditions continue to improve, as the Committee anticipates, the Committee will at some point begin considering an increase in the target range for the federal funds rate on a meeting-by-meeting basis. Before then, the Committee will change its forward guidance.
Yes, the FOMC needs to drop "patient" before they move to a meeting-by-meeting basis.
However, it is important to emphasize that a modification of the forward guidance should not be read as indicating that the Committee will necessarily increase the target range in a couple of meetings.
This was the clarification today. Although "patient" probably means no hike for at least two meetings, dropping "patient" does not mean a rate hike is guaranteed two meetings later - just that a hike may be considered based on incoming data (employment and inflation).

Right now I expect the FOMC to drop patient at the next meeting.

Wednesday:
• At 7:00 AM ET, Mortgage Bankers Association (MBA) will release the results for the mortgage purchase applications index.

• At 10:00 AM, New Home Sales for January from the Census Bureau. The consensus is for a decrease in sales to 471 thousand Seasonally Adjusted Annual Rate (SAAR) in January from 481 thousand in December.

• Also at 10:00 AM, Testimony, Fed Chair Janet Yellen, Semiannual Monetary Policy Report to the Congress, Before the House Financial Services Committee, Washington, D.C. (Report will be a repeat, plus Q&A).

Lawler on Toll Brothers and Other Builders: Maybe Points to Strong New Home Sales in January

From housing economist Tom Lawler: Toll Brothers: Net Orders Up 16% YOY in Latest Quarter; “Traditional” Net Orders Up 20.7%; Ex the West, Net Orders Down

Toll Brothers, the self-described “nation’s leading builder of luxury homes,” reported that net home orders in the quarter ended January 31, 2015 totaled 1,063, up 16.0% from the disappointed orders in the comparable quarter of 2014. Net orders per community were up 3.5% from a year earlier. Net orders in the company’s “traditional” home building operations totaled 1,044, up 20.7% from the comparable quarter of 2014. Home deliveries last quarter totaled 1,091, up 17.6% from the comparable quarter of 2014, at an average sales price of $782,300, up 12.8% from a year earlier. “Traditional” home delivers totaled 1,091, up 17.5% from the comparable quarter of 2014, at an average sales price of $714,900, up 2.8% from a year earlier. The company’s order backlog at the end of January was 3,651, down 0.4% from last January, at an average order price of $750,000, up 2.5% from a year earlier. The backlog for traditional building at the end of January was 3,536, up 2.9% from last January, at an average sales price of $732,000, up 4.5% from a year earlier.

Compared to a year ago Toll’s traditional net orders were down in every region save the West (Arizona, California, Colorado, Nevada, and Washington), as shown in the table below. Part of the YOY gain in the West reflected orders from lots and communities in California obtained from the acquisition of Shapell Industries, which closed last February. That acquisition included 5,219 lots in Northern and Southern California, 4,122 of which were not finished as of 8/31/2013. When asked whether the strong YOY growth in net orders in the West reflected orders associated with the Shappell acquisition or from “core” strength in the region, a company official said “it was both.” The fact that Toll’s net order (and settlement) price in the West was down from a year ago, however, suggested that a “good chunk” of the YOY order gain in the West was related to the Shapell acquisition (Shapell’s average sales price had been lower than Toll’s) – especially given management’s discussion of “pricing power” in many California markets.

  Net Home OrdersAverage Net Order Price
Qtr. Ended:1/31/20151/31/2014% Chg.1/31/20151/31/2014% Chg.
North177181-2.2%$625,100$652,900-4.3%
Mid-Atlantic224263-14.8%$659,500$623,1005.8%
South199222-10.4%$850,700$758,10012.2%
West444199123.1%$905,100$944,100-4.1%
   Traditional104486520.7%$794,000$737,8007.6%
   City Living1951-62.7%$2,301,900$1,245,70084.8%
Total106391616.0%$821,500$766,1007.2%

On the “pricing power” front, while on the December conference call officials focused on the reduction in pricing power across many of its markets, today officials seemed a touch more optimistic – although comments with vague, save that in Northern California, Southern California, the New York City area, and certain parts of Florida pricing power appeared to have improved.

Officials also said since the start of the current quarter (February 1), signed contracts were running about 13% higher than the comparable period of 2014.

And Some News from Other Builders Points to Strong New Home Sales in January (maybe)

In significantly older news but related to early 2015 home sales, KB Home reported (on February 11) that net home orders from December 1, 2014 through February 6, 2015 totaled 1,499, up 24.8% from the comparable period of a year earlier. At the beginning of its current fiscal quarter (which runs from December 1, 2014 through February 28, 2015) the company had 227 communities for sale, up 19% from a year earlier. Quarter-to-date net order value over this period was up 25.5% from the comparable year-earlier period, implying a YOY gain in net order price of about 1%.

KB Home released these preliminary quarter-to-date order numbers in conjunction with the commencement of a public offerening of $250 million in senior notes.

Meanwhile, in anticipation of management’s meetings with investors at a conference this week, Meritage Homes reported that net home orders in January totaled 606, up 48% from last January. Meritage said that net orders per community were up 24% YOY.

While it is dangerous to attempt to translate reported net orders from builders to Census’ estimates for new home sales – even when one has a lot of builder reports – my “gut” tells me that Census’ report on new home sales for January will beat “consensus.”

CR Note: New Home sales for January will be released tomorrow morning at 10:00 AM ET. The consensus is for a decrease in sales to 471 thousand Seasonally Adjusted Annual Rate (SAAR) in January from 481 thousand in December.

FDIC: Fewer Problem banks, Residential REO Declines in Q4

The FDIC released the Quarterly Banking Profile for Q4 today.
The banking industry continued to improve at the end of the year. Although total industry earnings declined as a result of significant litigation expenses at a few large institutions and a continued decline in mortgage-related income, a majority of banks reported higher operating revenues and improved earnings from the previous year. In addition, banks made loans at a faster pace, asset quality improved, and the number of banks on the problem list declined to the lowest level in six years.
...
[F]ourth quarter net income was 36.9 billion dollars, down 7.3 percent from the prior year. The principal reasons for the decline were a 4.4 billion dollar increase in litigation expenses concentrated at a few large institutions and a 1.6 billion dollar decline in mortgage-related noninterest income.
emphasis added
FDIC Problem Banks Click on graph for larger image.

The FDIC reported the number of problem banks declined (Note: graph shows problem banks quarterly for 2014, and year end prior to 2014):
The number of banks on the problem list fell to the lowest level since the third quarter of 2008. There were 291 banks on the problem list at the end of 2014, less than one-third of the 888 problem banks at the peak in March 2011. Total assets of banks on the problem list fell to 87 billion dollars.

This is the first time problem bank assets have been below 100 billion dollars since March 2008.
FDIC Insured Institution REOThe dollar value of 1-4 family residential Real Estate Owned (REOs, foreclosure houses) declined from $6.10 billion in Q3 2014 to $5.98 billion in Q4. This is the lowest level of REOs since Q3 2007.

This graph shows the dollar value of Residential REO for FDIC insured institutions. Note: The FDIC reports the dollar value and not the total number of REOs.

A Comment on House Prices: Real Prices and Price-to-Rent Ratio in December

First, S&P's David Blitzer said this morning "The housing recovery is faltering." I disagree with that wording. The level of housing starts and new home sales are still historically weak, but are clearly recovering - and I expect the housing recovery to continue (not "falter").

Second, the expected slowdown in year-over-year price increases has occurred. In October 2013, the National index was up 10.9% year-over-year (YoY). In December 2014, the index was up 4.6% YoY. The YoY change has held steady for the last four months.

Looking forward, I expect the YoY increases for the indexes to move more sideways (as opposed to down).   Two points: 1) I don't expect (as some) for the indexes to turn negative YoY (in 2015) , and 2) I think most of the slowdown on a YoY basis is now behind us. This slowdown in price increases was expected by several key analysts, and I think it was good news for housing and the economy.

In the earlier post, I graphed nominal house prices, but it is also important to look at prices in real terms (inflation adjusted).  Case-Shiller, CoreLogic and others report nominal house prices.  As an example, if a house price was $200,000 in January 2000, the price would be close to $275,000 today adjusted for inflation (38%).  That is why the second graph below is important - this shows "real" prices (adjusted for inflation).

It has been almost ten years since the bubble peak.  In the Case-Shiller release this morning, the National Index was reported as being 8.4% below the bubble peak.   However, in real terms, the National index is still about 22% below the bubble peak.

Nominal House Prices

Nominal House PricesThe first graph shows the monthly Case-Shiller National Index SA, the monthly Case-Shiller Composite 20 SA, and the CoreLogic House Price Indexes (through December) in nominal terms as reported.

In nominal terms, the Case-Shiller National index (SA) is back to May 2005 levels, and the Case-Shiller Composite 20 Index (SA) is back to December 2004 levels, and the CoreLogic index (NSA) is back to February 2005.

Real House Prices

Real House PricesThe second graph shows the same three indexes in real terms (adjusted for inflation using CPI less Shelter). Note: some people use other inflation measures to adjust for real prices.

In real terms, the National index is back to April 2003 levels, the Composite 20 index is back to November 2002, and the CoreLogic index back to March 2003.

In real terms, house prices are back to early '00s levels.

Price-to-Rent

In October 2004, Fed economist John Krainer and researcher Chishen Wei wrote a Fed letter on price to rent ratios: House Prices and Fundamental Value. Kainer and Wei presented a price-to-rent ratio using the OFHEO house price index and the Owners' Equivalent Rent (OER) from the BLS.

Price-to-Rent RatioHere is a similar graph using the Case-Shiller National, Composite 20 and CoreLogic House Price Indexes.

This graph shows the price to rent ratio (January 1998 = 1.0).

On a price-to-rent basis, the Case-Shiller National index is back to May 2003 levels, the Composite 20 index is back to December 2002 levels, and the CoreLogic index is back to March 2003.

In real terms, and as a price-to-rent ratio, prices are mostly back to early 2000 levels - and maybe moving a little sideways now.

Yellen: Semiannual Monetary Policy Report to the Congress

Federal Reserve Chair Janet Yellen testimony "Semiannual Monetary Policy Report to the Congress" Before the Senate Banking, Housing, and Urban Affairs Committee, Washington, D.C. (starts at 10 AM ET):
The FOMC's assessment that it can be patient in beginning to normalize policy means that the Committee considers it unlikely that economic conditions will warrant an increase in the target range for the federal funds rate for at least the next couple of FOMC meetings. If economic conditions continue to improve, as the Committee anticipates, the Committee will at some point begin considering an increase in the target range for the federal funds rate on a meeting-by-meeting basis. Before then, the Committee will change its forward guidance. However, it is important to emphasize that a modification of the forward guidance should not be read as indicating that the Committee will necessarily increase the target range in a couple of meetings. Instead the modification should be understood as reflecting the Committee's judgment that conditions have improved to the point where it will soon be the case that a change in the target range could be warranted at any meeting. Provided that labor market conditions continue to improve and further improvement is expected, the Committee anticipates that it will be appropriate to raise the target range for the federal funds rate when, on the basis of incoming data, the Committee is reasonably confident that inflation will move back over the medium term toward our 2 percent objective.

It continues to be the FOMC's assessment that even after employment and inflation are near levels consistent with our dual mandate, economic conditions may, for some time, warrant keeping the federal funds rate below levels the Committee views as normal in the longer run. It is possible, for example, that it may be necessary for the federal funds rate to run temporarily below its normal longer-run level because the residual effects of the financial crisis may continue to weigh on economic activity. As such factors continue to dissipate, we would expect the federal funds rate to move toward its longer-run normal level. In response to unforeseen developments, the Committee will adjust the target range for the federal funds rate to best promote the achievement of maximum employment and 2 percent inflation.
emphasis added
Here is the C-Span Link

Here is the Bloomberg TV link.

Case-Shiller: National House Price Index increased 4.6% year-over-year in December

S&P/Case-Shiller released the monthly Home Price Indices for December ("December" is a 3 month average of October, November and December prices).

This release includes prices for 20 individual cities, two composite indices (for 10 cities and 20 cities) and the monthly National index.

Note: Case-Shiller reports Not Seasonally Adjusted (NSA), I use the SA data for the graphs.

From S&P: Home Prices Grew at Twice the Rate of Inflation in 2014 According to the S&P/Case-Shiller Home Price Indices
Data released today for December 2014 shows a slight uptick in home prices across the country. Nine cities reported monthly increases in prices ... Both the 10-City and 20-City Composites saw year-over-year increases in December compared to November. The 10-City Composite gained 4.3% year-over-year, up from 4.2% in November. The 20-City Composite gained 4.5% year-over-year, compared to a 4.3% increase in November. The S&P/Case-Shiller U.S. National Home Price Index, which covers all nine U.S. census divisions, recorded a 4.6% annual gain in December 2014 versus 4.7% in November.
...
The National index was slightly negative in December, while both composite Indices were positive. Both the 10- and 20-City Composites reported slight increases of 0.1%, while the National Index posted a -0.1% change for the month. Miami and Denver led all cities in December with increases of 0.7% and 0.5% respectively. Chicago and Cleveland offset those gains by reporting decreases of -0.9% and -0.5% respectively.
...
“The housing recovery is faltering. While prices and sales of existing homes are close to normal, construction and new home sales remain weak. Before the current business cycle, any time housing starts were at their current level of about one million at annual rates, the economy was in a recession” says David M. Blitzer, Managing Director and Chairman of the Index Committee at S&P Dow Jones Indices. “The softness in housing is despite favorable conditions elsewhere in the economy: strong job growth, a declining unemployment rate, continued low interest rates and positive consumer confidence.
Case-Shiller House Prices Indices Click on graph for larger image.

The first graph shows the nominal seasonally adjusted Composite 10, Composite 20 and National indices (the Composite 20 was started in January 2000).

The Composite 10 index is off 16.7% from the peak, and up 0.8% in December (SA).

The Composite 20 index is off 15.6% from the peak, and up 0.9% (SA) in December.

The National index is off 8.4% from the peak, and up 0.7% (SA) in December.  The National index is up 23.7% from the post-bubble low set in Dec 2011 (SA).

Case-Shiller House Prices Indices The second graph shows the Year over year change in all three indices.

The Composite 10 SA is up 4.3% compared to December 2013.

The Composite 20 SA is up 4.5% year-over-year..

The National index SA is up 4.6% year-over-year.

Prices increased (SA) in all 20 of the 20 Case-Shiller cities in December seasonally adjusted.  (Prices increased in 9 of the 20 cities NSA)  Prices in Las Vegas are off 41.6% from the peak, and prices in Denver and Dallas are at new highs (SA).

This was close to the consensus forecast for a 4.7% YoY increase for the National index. I'll have more on house prices later.

Monday 23 February 2015

Tuesday: Yellen Testimony, Case-Shiller House Prices

A few excerpts from a preview of Yellen's Testimony by Goldman Sachs economists Kris Dawsey and Chris Mischaikow:
Fed Chair Yellen will be presenting her semi-annual monetary policy testimony—sometimes called the "Humphrey-Hawkins" testimony—on Tuesday and Wednesday of this week (February 24 and 25). We expect Yellen not to stray far from the message of the January FOMC statement and meeting minutes, and we do not think she will preempt the Committee by sending a strong signal on whether "patience" will be removed from the statement at the March meeting.

The testimony will probably not be a major market mover. Indeed, the average absolute yield change around the Fed Chair's semi-annual testimony has declined over time and is considerably lower than the average absolute change around post-FOMC press conferences. Nonetheless, to the extent there are risks to our "don't rock the boat" expectation, we think they are skewed toward a slightly more dovish tilt.
...
The Fed will also release its semi-annual Monetary Policy Report at 10:00AM on Tuesday February 24, which is a roughly fifty-page document that provides additional background, charts, etc. supporting the Chair's testimony. Typically, this document generates very little interest. However, the July statement that "valuation metrics in some sectors do appear substantially stretched—particularly those for smaller firms in the social media and biotechnology industries," received considerable attention.
Tuesday:
• At 9:00 AM ET, S&P/Case-Shiller House Price Index for December. Although this is the December report, it is really a 3 month average of October, November and December prices. The consensus is for a 4.7% year-over-year increase in the National Index for December. The Zillow forecast is for the National Index to increase 4.7% year-over-year in December, and for prices to increase 0.5% month-to-month seasonally adjusted.

• At 10:00 AM, Testimony, Fed Chair Janet Yellen, Semiannual Monetary Policy Report to the Congress, Before the Senate Banking, Housing, and Urban Affairs Committee, Washington, D.C.

• Also at 10:00 AM, Richmond Fed Survey of Manufacturing Activity for February.

• Also at 10:00 AM, Conference Board's consumer confidence index for February. The consensus is for the index to decrease to 99.1 from 102.9.

A Few Comments on January Existing Home Sales

Inventory is still very low (down 0.5% year-over-year in January). This will be important to watch over the next few months at the start of the Spring buying season.

Note: As usually happens, housing economist Tom Lawler's estimate was closer than the consensus to the NAR reported sales rate.

Also, the NAR reported total sales were up 3.2% from January 2014, however normal equity sales were up even more, and distressed sales down sharply.  From the NAR (from a survey that is far from perfect):
Distressed sales – foreclosures and short sales – were 11 percent of sales in January, unchanged from last month but down from 15 percent a year ago. Eight percent of January sales were foreclosures and 3 percent were short sales. 
Last year in December the NAR reported that 15% of sales were distressed sales.

A rough estimate: Sales in January 2014 were reported at 4.67 million SAAR with 15% distressed.  That gives 701 thousand distressed (annual rate), and 3.97 million equity / non-distressed.  In January 2015, sales were 4.82 million SAAR, with 11% distressed.  That gives 530 thousand distressed - a decline of about 24% from January 2014 - and 4.29 million equity.  Although this survey isn't perfect, this suggests distressed sales were down sharply - and normal sales up around 8%.

Important: If total existing sales decline a little, or move side-ways - due to fewer distressed sales- that is a positive sign for real estate.

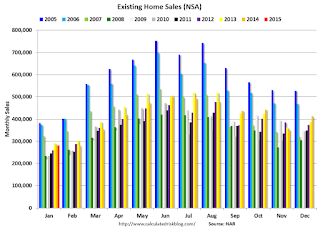
The following graph shows existing home sales Not Seasonally Adjusted (NSA).

Existing Home Sales NSAClick on graph for larger image.

Sales NSA in January (red column) were slightly higher than last year (NSA), and below sales in January 2013.

Earlier:
Existing Home Sales in January: 4.82 million SAAR, Inventory down slightly Year-over-year

Black Knight: House Price Index down slightly in December, Up 4.5% year-over-year

Note: I follow several house price indexes (Case-Shiller, CoreLogic, Black Knight, Zillow, FHFA, FNC and more). Note: Black Knight uses the current month closings only (not a three month average like Case-Shiller or a weighted average like CoreLogic), excludes short sales and REOs, and is not seasonally adjusted.

From Black Knight: U.S. Home Prices Down 0.1 Percent for the Month; Up 4.5 Percent Year-Over-Year
Today, the Data and Analytics division of Black Knight Financial Services released its latest Home Price Index (HPI) report, based on December 2014 residential real estate transactions. The Black Knight HPI combines the company’s extensive property and loan-level databases to produce a repeat sales analysis of home prices as of their transaction dates every month for each of more than 18,500 U.S. ZIP codes. The Black Knight HPI represents the price of non-distressed sales by taking into account price discounts for REO and short sales.
The Black Knight HPI decreased 0.1% percent in December, and is off 10.2% from the peak in June 2006 (not adjusted for inflation).

The year-over-year increases had been getting steadily smaller since peaking in 2013 - as shown in the table below - but the YoY increase has been about the same for the last four months:

MonthYoY House
Price Increase
Jan-136.7%
Feb-137.3%
Mar-137.6%
Apr-138.1%
May-137.9%
Jun-138.4%
Jul-138.7%
Aug-139.0%
Sep-139.0%
Oct-138.8%
Nov-138.5%
Dec-138.4%
Jan-148.0%
Feb-147.6%
Mar-147.0%
Apr-146.4%
May-145.9%
June-145.5%
July-145.1%
Aug-144.9%
Sep-144.6%
Oct-144.5%
Nov-144.5%
Dec-144.5%

The press release has data for the 20 largest states, and 40 MSAs.

Black Knight shows prices off 41.0% from the peak in Las Vegas, off 34.3% in Orlando, and 32.0% off from the peak in Riverside-San Bernardino, CA (Inland Empire). Prices are at new highs in Colorado and Texas (Denver, Austin, Dallas, Houston). Prices are also at new highs in Nashville, TN, and San Jose, CA.

Note: Case-Shiller for December will be released tomorrow.

Existing Home Sales in January: 4.82 million SAAR, Inventory down slightly Year-over-year

The NAR reports: Existing-Home Sales Cool in January As Available Inventory Remains Subdued
Total existing-home sale1, which are completed transactions that include single-family homes, townhomes, condominiums and co-ops, fell 4.9 percent to a seasonally adjusted annual rate of 4.82 million in January (lowest since last April at 4.75 million) from an upwardly-revised 5.07 million in December. Despite January’s decline, sales are higher by 3.2 percent than a year ago. ...

Total housing inventory at the end of January increased 0.5 percent to 1.87 million existing homes available for sale, but is 0.5 percent lower than a year ago (1.88 million). Unsold inventory is at a 4.7-month supply at the current sales pace – up from 4.4 months in December.
Existing Home SalesClick on graph for larger image.

This graph shows existing home sales, on a Seasonally Adjusted Annual Rate (SAAR) basis since 1993.

Sales in January (4.82 million SAAR) were 4.9% lower than last month, and were 3.2% above the January 2014 rate.

The second graph shows nationwide inventory for existing homes.

Existing Home InventoryAccording to the NAR, inventory increased to 1.87 million in January from 1.86 million in December.   Headline inventory is not seasonally adjusted, and inventory usually decreases to the seasonal lows in December and January, and peaks in mid-to-late summer.

The third graph shows the year-over-year (YoY) change in reported existing home inventory and months-of-supply. Since inventory is not seasonally adjusted, it really helps to look at the YoY change. Note: Months-of-supply is based on the seasonally adjusted sales and not seasonally adjusted inventory.

Year-over-year Inventory Inventory decreased 0.5% year-over-year in January compared to January 2014.  

Months of supply was at 4.7 months in January.

This was below expectations of sales of 5.00 million.  For existing home sales, a key number is inventory - and inventory is still low.    I'll have more later ...