The National Association of Realtors reported that its Pending Home Sales Index, designed to gauge contract-signing activity on MLS-based existing home sales, increased by 1.2% on a seasonally adjusted basis from December to 104.2 in January. A value of 100 is equal to the average level of contract activity in 2001.
There were significant revisions in historical data – not just seasonally adjusted data but unadjusted data – with all of the unadjusted revisions coming in the West region. As I had noted several times over the past year, most recently in the October 1, 2014 LEHC report (“NAR’s Pending Home Sales Index: The “Curious Case” of the Wild, Wild West”), the NAR’s Pending Home Sales Index for the West had previously made no sense either in terms of the pattern of pending sales vs. closed sales in that region, or in terms of pending sales reports from realtors/MLS in the region. I sent that report to the NAR, and one of their analysts told me that they were aware that the pending data in the West did not look correct, and were looking through archived records to figure out why. Apparently the NAR “found” out why, and the PHSI for the West was revised massively in today’s report, as shown in the table below.
| NAR Pending Home Sales Index for the West Region, 2014 (Not Seasonally Adjusted, 2001 = 100 | |||
|---|---|---|---|
| December 2014 Report | January 2015 Report | % Change | |
| Jan | 79.4 | 78.0 | -1.7% |
| Feb | 67.9 | 83.0 | 22.3% |
| Mar | 88.6 | 104.2 | 17.6% |
| Apr | 79.9 | 105.0 | 31.5% |
| May | 99.9 | 106.1 | 6.2% |
| June | 100.7 | 103.2 | 2.5% |
| July | 109.7 | 104.1 | -5.1% |
| Aug | 126.2 | 100.9 | -20.0% |
| Sept | 111.2 | 94.4 | -15.1% |
| Oct | 109.8 | 93.3 | -15.0% |
| Nov | 101.6 | 76.8 | -24.4% |
| Dec | 65.3 | 65.3 | 0.0% |
 Click on graph for larger image
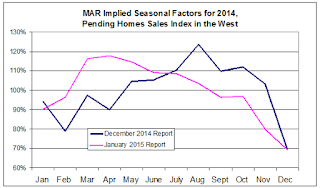
The NAR’s revisions also produced massive changes in the implied seasonal pattern of Pending Home Sales in the West, from the previously “silly” looking pattern to a more reasonable pattern, as shown on this graph.
Prior to the recent revision the NAR’s Pending Home Sales in the West showed a seasonal peak in August, while NAR estimates of closed existing home sales showed a typical seasonal peak in the May/June period. Local realtor reports in the West – including that of the California Association of Realtors – showed pending sales as reaching a seasonal peak around April, a result much more consistent with the seasonal pattern of closed sales.
The revisions in the Pending Home Sales Index for the West go way back, and the West PHSI for 2012, 2013, and 2014 were all revised downward by about 2.3 percentage points.
The revisions in the West PHSI, combined with annual benchmark seasonal adjustment revisions, produced the following changes in the NAR’s National Pending Home Sales Index for 2014.
| NAR National Pending Home Sales Index for 2014, Seasonally Adjusted (2001 = 100) | |||
|---|---|---|---|
| December 2014 Report | January 2015 Report | % Change | |
| Jan | 94.7 | 96.1 | 1.5% |
| Feb | 94.2 | 95.4 | 1.3% |
| Apr | 97.9 | 98.6 | 0.7% |
| May | 103.8 | 101.9 | -1.8% |
| June | 102.5 | 101.9 | -0.6% |
| July | 105.8 | 103.3 | -2.3% |
| Aug | 104.7 | 103.1 | -1.6% |
| Sept | 105.3 | 103.7 | -1.5% |
| Oct | 104.0 | 103.7 | -0.3% |
| Nov | 104.6 | 104.1 | -0.5% |
| Dec | 100.7 | 102.5 | 1.8% |
CR Note: The index was reported at 104.2 in January 2015.
No comments:
Post a Comment