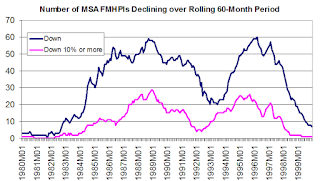
Using the Freddie Mac Home Price Index for 369 MSAs, below is a chart showing the number of MSAs where the FMHPI over 60-month period ending in the date shown either (1) declined, or (2) fell by at least 10%. (The FMHPIs are based on repeat transactions of homes backing GSE mortgages, and data are available back to January 1975.) The first chart covers the five-year period ending January 1980 through the five-year period ending December 1999.
In five-year periods that including the late 70’s there were very few MSAs whose HPI fell over those five years, mainly because this was a period of very high inflation (see last page). That changed significantly as inflation fell (and following a serve recession), and the number of MSAs experiencing home price declines over a five year period increased significantly in the 80’s – with the most severe declines coming in the oil-patch states. There was another significantly jump in the number of areas experiencing “sustained” home price declines in the 90’s, including many Northeast markets (including the Boston “bubble/bust,” with the bust from the late 80’s through the early/mid 90’s) and the California “boom/bust” (especially Southern California, with the bust from the summer of 1990 through the beginning of 1996.

The above chart doesn’t reflect the number of MSAs who have ever experienced a decline in home prices over a five-year period from 1975 to 1999, but rather the number whose HPI over the same five-year period experienced a drop. Over the 1975-1999 period the FMHPI for 198 MSAs saw a decline over some five year period, and the FMHPI for 87 MSAs fell by 10% or more. And for the top 25 MSAs (in terms of population), 15 experienced a decline in home prices over some five period from 1975 to 1999, with eight experienced a double-digit drop over some five year period (including four out of the top five MSAs.).
Now let’s look at the same chart, but expanding to include the period through 2005.

As the chart indicates, from the five-year period ending in late 2001 through the five-year period ending in late 2005, there were NO MSAs that saw a decline in their respective FMHPIs. Stated another way, for folks trying to “model” mortgage credit default using loan-level data only available on mortgages originated from 1996 through 2005, there were virtually NO areas of the country that were “distressed” in terms of experiencing a decline in home prices over any five-year period.
Now let’s extend the chart through September of 2014.

Oh My!
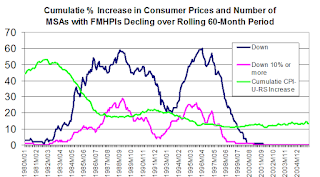
Finally, here is a chart comparing consumer price inflation (cumulative, using the CPI-U-RS) over a rolling 60-month period with the number of MSAs experiencing a decline in their respective HPIs over the same rolling 60-month period. The chart ends in 2005.

During the period from the second half of the 70’s through the very early part of the 80’s, there were few MSAs experiencing sustained home price declines, in part because of high inflation. That was obviously not the case during the period from the latter half of the 90’s through the middle of last decade.
No comments:
Post a Comment