Friday, 22 May 2015

ATA Trucking Index decreased 3% in April

Here is an indicator that I follow on trucking, from the ATA: ATA Truck Tonnage Index Fell 3% in April
American Trucking Associations’ advanced seasonally adjusted For-Hire Truck Tonnage Index fell 3% in April, following a revised gain of 0.4% during the previous month. In April, the index equaled 128.6 (2000=100), which was the lowest level since April 2014. The all-time high is 135.8, reached in January 2015.

Compared with April 2014, the SA index increased just 1%, which was well below the 4.2% gain in March and the smallest year-over-year gain since February 2013. ...

“Like most economic indicators, truck tonnage was soft in April,” said ATA Chief Economist Bob Costello. “Unless tonnage snaps back in May and June, GDP growth will likely be suppressed in the second quarter.”

Costello added that truck tonnage is off 5.3% from the high in January.

“The next couple of months will be telling for both truck freight and the broader economy. Any significant jump from the first quarter is looking more doubtful,” he said.

Trucking serves as a barometer of the U.S. economy, representing 68.8% of tonnage carried by all modes of domestic freight transportation, including manufactured and retail goods. Trucks hauled just under 10 billion tons of freight in 2014. Motor carriers collected $700.4 billion, or 80.3% of total revenue earned by all transport modes.
emphasis added
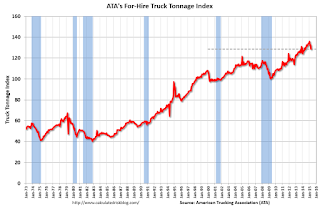
ATA Trucking Click on graph for larger image.

Here is a long term graph that shows ATA's For-Hire Truck Tonnage index.

The dashed line is the current level of the index.

The index is now up only 1.0% year-over-year.
Yellen: Expect Rate Hike in 2015, Several Years before Fed Funds Rate "back to normal" level

From Fed Chair Janet Yellen: The Outlook for the Economy
[I]f the economy continues to improve as I expect, I think it will be appropriate at some point this year to take the initial step to raise the federal funds rate target and begin the process of normalizing monetary policy. To support taking this step, however, I will need to see continued improvement in labor market conditions, and I will need to be reasonably confident that inflation will move back to 2 percent over the medium term.

After we begin raising the federal funds rate, I anticipate that the pace of normalization is likely to be gradual. The various headwinds that are still restraining the economy, as I said, will likely take some time to fully abate, and the pace of that improvement is highly uncertain. If conditions develop as my colleagues and I expect, then the FOMC's objectives of maximum employment and price stability would best be achieved by proceeding cautiously, which I expect would mean that it will be several years before the federal funds rate would be back to its normal, longer-run level.

Having said that, I should stress that the actual course of policy will be determined by incoming data and what that reveals about the economy. We have no intention of embarking on a preset course of increases in the federal funds rate after the initial increase. Rather, we will adjust monetary policy in response to developments in economic activity and inflation as they occur. If conditions improve more rapidly than expected, it may be appropriate to raise interest rates more quickly; conversely, the pace of normalization may be slower if conditions turn out to be less favorable.
emphasis added

Key Measures Show Low Inflation in April

The Cleveland Fed released the median CPI and the trimmed-mean CPI this morning:
According to the Federal Reserve Bank of Cleveland, the median Consumer Price Index rose 0.2% (2.2% annualized rate) in April. The 16% trimmed-mean Consumer Price Index also rose 0.2% (2.2% annualized rate) during the month. The median CPI and 16% trimmed-mean CPI are measures of core inflation calculated by the Federal Reserve Bank of Cleveland based on data released in the Bureau of Labor Statistics’ (BLS) monthly CPI report.

Earlier today, the BLS reported that the seasonally adjusted CPI for all urban consumers rose 0.1% (1.2% annualized rate) in April. The CPI less food and energy rose 0.3% (3.1% annualized rate) on a seasonally adjusted basis.
Note: The Cleveland Fed has the median CPI details for April here.

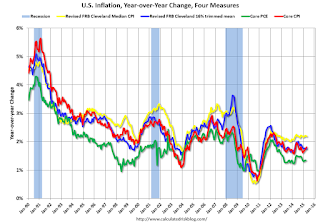
Inflation Measures Click on graph for larger image.

This graph shows the year-over-year change for these four key measures of inflation. On a year-over-year basis, the median CPI rose 2.2%, the trimmed-mean CPI rose 1.7%, and the CPI less food and energy rose 1.8%. Core PCE is for March and increased 1.35% year-over-year.

On a monthly basis, median CPI was at 2.2% annualized, trimmed-mean CPI was at 2.2% annualized, and core CPI was at 3.1% annualized.

On a year-over-year basis these measures suggest inflation remains below the Fed's target of 2% (median CPI is slightly above 2%).

The key question for the Fed is if these key measures will move back towards 2%.

BLS: CPI increased 0.1% in April, Core CPI increased 0.3%

From the BLS:
The Consumer Price Index for All Urban Consumers (CPI-U) increased 0.1 percent in April on a seasonally adjusted basis, the U.S. Bureau of Labor Statistics reported today. Over the last 12 months, the all items index declined 0.2 percent before seasonal adjustment.

The index for all items less food and energy rose 0.3 percent in April and led to the slight increase in the seasonally adjusted all items index.
emphasis added
I'll post a graph later today after the Cleveland Fed releases the median and trimmed-mean CPI. This was at the consensus forecast of a 0.1% increase for CPI, and above the forecast of a 0.1% increase in core CPI.

Black Knight: Mortgage Delinquencies increased slightly in April

According to Black Knight's First Look report for April, the percent of loans delinquent increased 1% in April compared to March, and declined 15% year-over-year.

The percent of loans in the foreclosure process declined 2% in March and were down 25% over the last year.

Black Knight reported the U.S. mortgage delinquency rate (loans 30 or more days past due, but not in foreclosure) was 4.77% in April, up from 4.70% in March.

The percent of loans in the foreclosure process declined in April to 1.51%.  This was the lowest level of foreclosure inventory since January 2008.

The number of delinquent properties, but not in foreclosure, is down 406,000 properties year-over-year, and the number of properties in the foreclosure process is down 252,000 properties year-over-year.

Black Knight will release the complete mortgage monitor for April in early June.

Black Knight: Percent Loans Delinquent and in Foreclosure Process
  Apr
2015
Mar
2015
Apr
2014
Apr
2013
Delinquent4.77%4.70%5.62%6.21%
In Foreclosure1.51%1.55%2.02%3.17%
Number of properties:
Number of properties that are 30 or more, and less than 90 days past due, but not in foreclosure:1,463,0001,409,0001,634,0001,717,000
Number of properties that are 90 or more days delinquent, but not in foreclosure:952,000971,0001,187,0001,394,000
Number of properties in foreclosure pre-sale inventory:764,000782,0001,016,0001,588,000
Total Properties3,179,0003,162,0003,837,0004,699,000

Thursday, 21 May 2015

Friday: CPI, Yellen

Earlier from the Philly Fed: May Manufacturing Survey
Manufacturing activity in the region increased modestly in May, according to firms responding to this month’s Manufacturing Business Outlook Survey. Indicators for general activity, new orders, and shipments were positive but remain at low readings. Employment increased at the reporting firms, but the employment index moderated compared with April. Firms reported continued price reductions in May, with indicators for prices of inputs and the firms’ own products remaining negative. The survey’s indicators of future activity suggest that firms expect continuing growth in the manufacturing sector over the next six months.
...
The survey’s broadest measure of manufacturing conditions, the diffusion index of current activity, decreased from 7.5 in April to 6.7 in May. ...

Firms’ responses suggest some weakening in labor market conditions this month compared with April. ... The current employment index, however, fell 5 points, to 6.7.
emphasis added
This was below the consensus forecast of a reading of 8.0 for May.

Also the Kansas City Fed reported: Tenth District Manufacturing Activity Declined More Sharply
“Factories in our region saw an even sharper decline in May than in March or April, as exports fell further and energy-related producers saw another drop in orders,” said [Chad Wilkerson, vice president and economist at the Federal Reserve Bank of Kansas City] “However, firms’ overall still plan a modest increase in employment over the next six to twelve months.”
...
Tenth District manufacturing activity declined more sharply in May than in previous months and producers’ expectations also fell, with both reaching their lowest levels since mid-2009. ... The month-over-month composite index was -13 in May, down from -7 in April and -4 in March ... Production fell most sharply in energy-producing states like Oklahoma and New Mexico, but it was also down in most other District states.
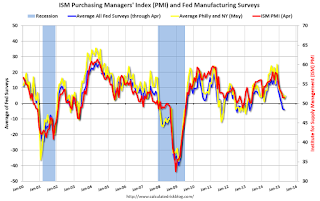
ISM PMI Click on graph for larger image.

Here is a graph comparing the regional Fed surveys and the ISM manufacturing index. The yellow line is an average of the NY Fed (Empire State) and Philly Fed surveys through May. The ISM and total Fed surveys are through April.

The average of the Empire State and Philly Fed surveys increased slightly in May, and this suggests a another weak ISM report for May.

Friday:
• At 8:30 AM ET, the Consumer Price Index for April from the BLS. The consensus is for a 0.1% increase in prices, and a 0.1% increase in core CPI.

• At 1:00 PM, Speech by Fed Chair Janet L. Yellen, U.S. Economic Outlook, At the Greater Providence Chamber of Commerce Economic Outlook Luncheon, Providence, Rhode Island

Lawler: Updated Table of Distressed Sales and Cash buyers for Selected Cities in April

Economist Tom Lawler sent me the updated table below of short sales, foreclosures and cash buyers for several selected cities in April.

On distressed: Total "distressed" share is down in most of these markets mostly due to a decline in short sales (Mid-Atlantic is up year-over-year because of an increase in foreclosures in Baltimore).

Short sales are down in these areas.

The All Cash Share (last two columns) is declining year-over-year. As investors pull back, the share of all cash buyers has been declining.

  Short Sales ShareForeclosure Sales Share Total "Distressed" ShareAll Cash Share
Apr-15Apr-14Apr-15Apr-14Apr-15Apr-14Apr-15Apr-14
Las Vegas7.2%12.4%8.3%11.4%15.5%23.8%30.4%41.4%
Reno**6.0%15.0%5.0%6.0%11.0%21.0%   
Phoenix2.5%4.0%3.8%6.5%6.3%10.5%25.3%32.2%
Sacramento5.6%9.5%6.6%7.5%12.2%17.0%18.4%21.9%
Minneapolis2.9%5.1%9.2%16.0%12.0%21.1%   
Mid-Atlantic4.5%5.9%12.9%10.0%17.3%15.9%17.2%19.5%
Orlando4.8%9.1%24.7%23.7%29.5%32.8%37.4%42.4%
Florida SF4.0%6.9%19.1%21.1%23.1%28.0%37.2%43.4%
Florida C/TH2.0%4.5%14.6%15.6%16.6%20.1%65.4%70.9%
Miami MSA SF6.2%10.5%18.4%16.5%24.7%27.0%37.8%44.4%
Miami MSA C/TH2.3%5.5%18.2%17.5%20.6%23.0%68.9%73.4%
Tampa MSA SF4.5%7.0%20.3%23.2%24.8%30.1%34.5%41.6%
Tampa MSA C/TH2.9%4.6%15.5%18.8%18.4%23.3%60.8%66.7%
So. California*4.4%5.0%4.5%5.2%8.9%10.2%   
Chicago (city)        20.3%27.3%   
Hampton Roads        22.2%24.4%   
Northeast Florida        28.9%38.0%   
Hampton Roads        22.2%24.4%   
Tucson            27.1%30.5%
Toledo            30.2%33.4%
Wichita            19.8%25.1%
Des Moines            13.8%17.1%
Peoria            17.3%21.2%
Georgia***            21.6%34.3%
Omaha            16.4%22.3%
Pensacola            32.3%35.6%
Knoxville            23.1%25.3%
Richmond VA MSA    11.5%15.4%    18.2%22.5%
Memphis    16.1%17.3%       
Springfield IL**    10.3%13.2%    17.9%N/A
*share of existing home sales, based on property records
**Single Family Only
***GAMLS