The U.S. Census Bureau and the U.S. Bureau of Economic Analysis, through the Department of Commerce, announced today that the goods and services deficit was $51.4 billion in March, up $15.5 billion from $35.9 billion in February, revised. March exports were $187.8 billion, $1.6 billion more than February exports. March imports were $239.2 billion, $17.1 billion more than February imports.The trade deficit much larger than the consensus forecast of $42.0 billion.
The first graph shows the monthly U.S. exports and imports in dollars through March 2015.
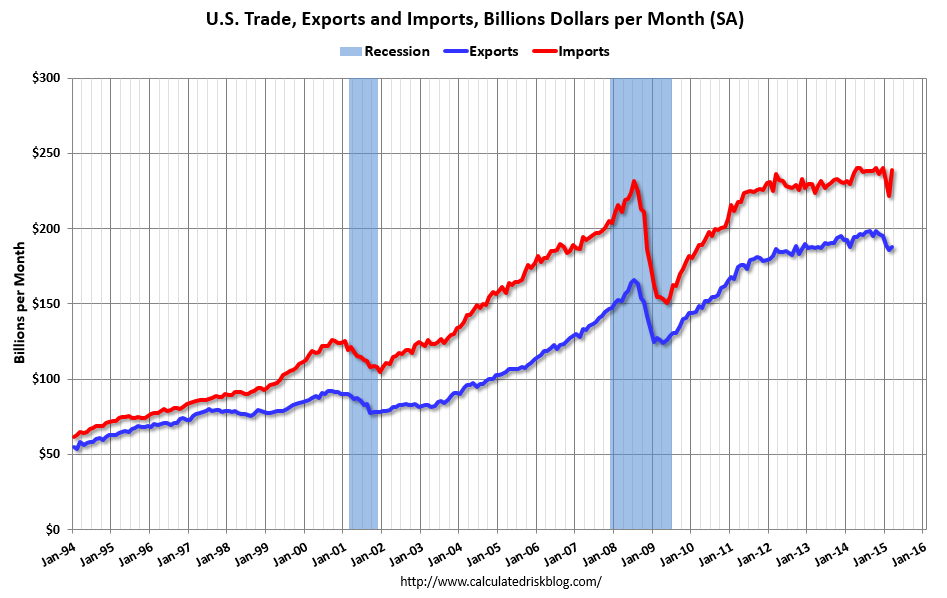 Click on graph for larger image.
Imports and exports increased in March ( due a bounce back following the resolution of the West Coast port slowdown).
Exports are 13% above the pre-recession peak and down 3% compared to March 2014; imports are 3% above the pre-recession peak, and up 1% compared to March 2014.
The second graph shows the U.S. trade deficit, with and without petroleum.
 The blue line is the total deficit, and the black line is the petroleum deficit, and the red line is the trade deficit ex-petroleum products.
Oil imports averaged $46.47 in March, down from $49.53 in February, and down from $93.91 in March 2014. The petroleum deficit has generally been declining and is the major reason the overall deficit has declined since early 2012.
The trade deficit with China increased to $31.2 billion in March, from $20.4 billion in March 2014. Much of this increase was due to unloading all the ships backed up at West Coast ports. The deficit with China is a large portion of the overall deficit.
Note: The deficit was larger than the BEA assumed for the advance GDP estimate, and this suggests GDP be revised down for Q1.
No comments:
Post a Comment