Here is a final update (until the next recession) to four key indicators used by the NBER for business cycle dating: GDP, Employment, Industrial production and real personal income less transfer payments.
Note: The following graphs are all constructed as a percent of the peak in each indicator. This shows when the indicator has bottomed - and when the indicator has returned to the level of the previous peak. If the indicator is at a new peak, the value is 100%.
All four of the indicators are above pre-recession levels (GDP and Personal Income less Transfer Payments, Industrial Production, and employment).
 Click on graph for larger image.
The first graph is for real GDP through Q1 2015.
Real GDP returned to the pre-recession peak in Q3 2011, and is at a new post-recession high (although Q1 2015 GDP might be revised down).
At the worst point - in Q2 2009 - real GDP was off 4.2% from the 2007 peak.
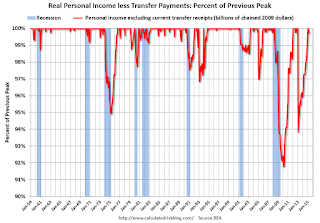
 The second graph shows real personal income less transfer payments as a percent of the previous peak through the March 2015 report.
This indicator was off 8.3% at the worst point.
Real personal income less transfer payments reached the pre-recession peak in January 2012. Then real personal income less transfer payments increased sharply in December 2012 due to a one time surge in income as some high income earners accelerated earnings to avoid higher taxes in 2013. This is why there is a second dip in this indicator in 2013.
Real personal income less transfer payments are now above the pre-recession peak - and above the December 2012 surge.
 The third graph is for industrial production through March 2015.
Industrial production was off 16.9% at the trough in June 2009.
There has been a little weakness recently (mostly related to oil and gas), and now industrial production is 4.4% above the pre-recession peak.
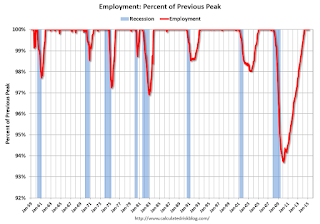
The final graph is for employment through March 2015.
 Employment is probably the most important indicator and payroll employment exceeded pre-recession levels in April 2014.
Payroll employment is now 2.0% above the pre-recession peak.
No comments:
Post a Comment